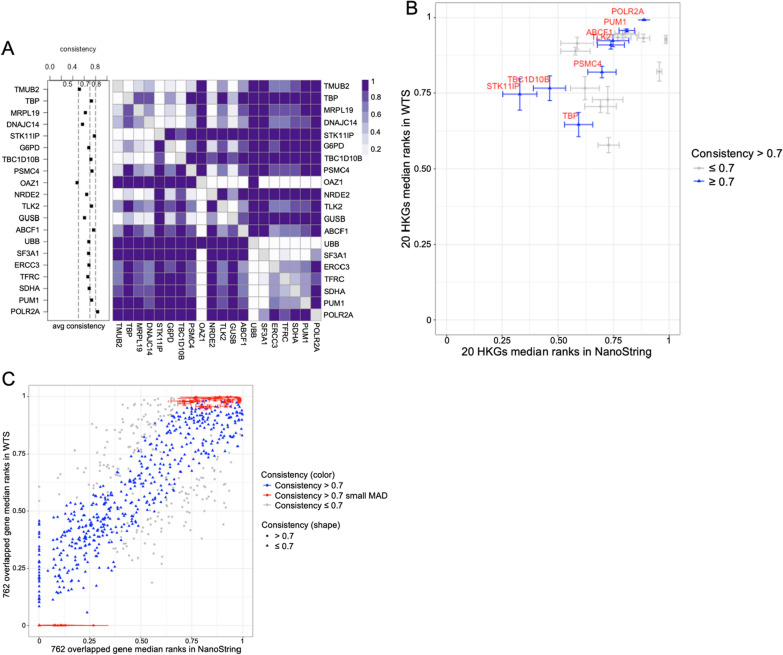
Fig. 4.
Rank consistency between NanoString and WTS platforms. A Cross-platform average consistency scores of 20 HKGs. The color bar indicates the pairwise consistency score. The darker colour in one cell represents a more consistent rank among the overlapping samples between this pair of genes. The left dot plot is each HKG’s average consistency. B, C The x- and y-axes are the median of the relative gene ranks in the NanoString and WTS platforms. The genes with average consistency scores > 0.7 in the NanoString platform are labelled. The horizontal and vertical error bars show the MAD of gene relative ranks in the NanoString and WTS platforms. B Rank locations and dispersions of 20 HKGs. C Rank locations of all 762 overlapping genes. The high consistency is average consistency score > 0.7; The high consistency, small MAD highlight the top 50 low MAD genes

