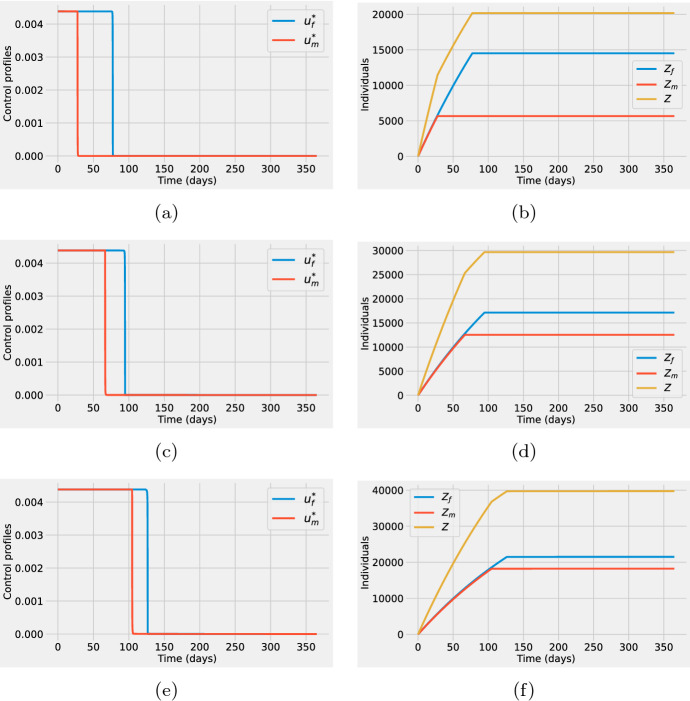
Fig. 4.
First column: Optimal time-dependent vaccination rates for females (blue) and males (red). Second column: Cumulative number of vaccinated females (blue) and vaccinated males (red) computed from the optimal states corresponding to the optimal controls on the first column. The total cumulative number of vaccines administered, Z(t), is shown in yellow. For both columns, the supply of vaccines corresponds to 20% (a, b) (first row), 30% (c, d) (second row), and 40% (e, f) (third row) of the total population. Baseline parameter values are listed in Table 1. Initial conditions are , , and , (color figure online)

