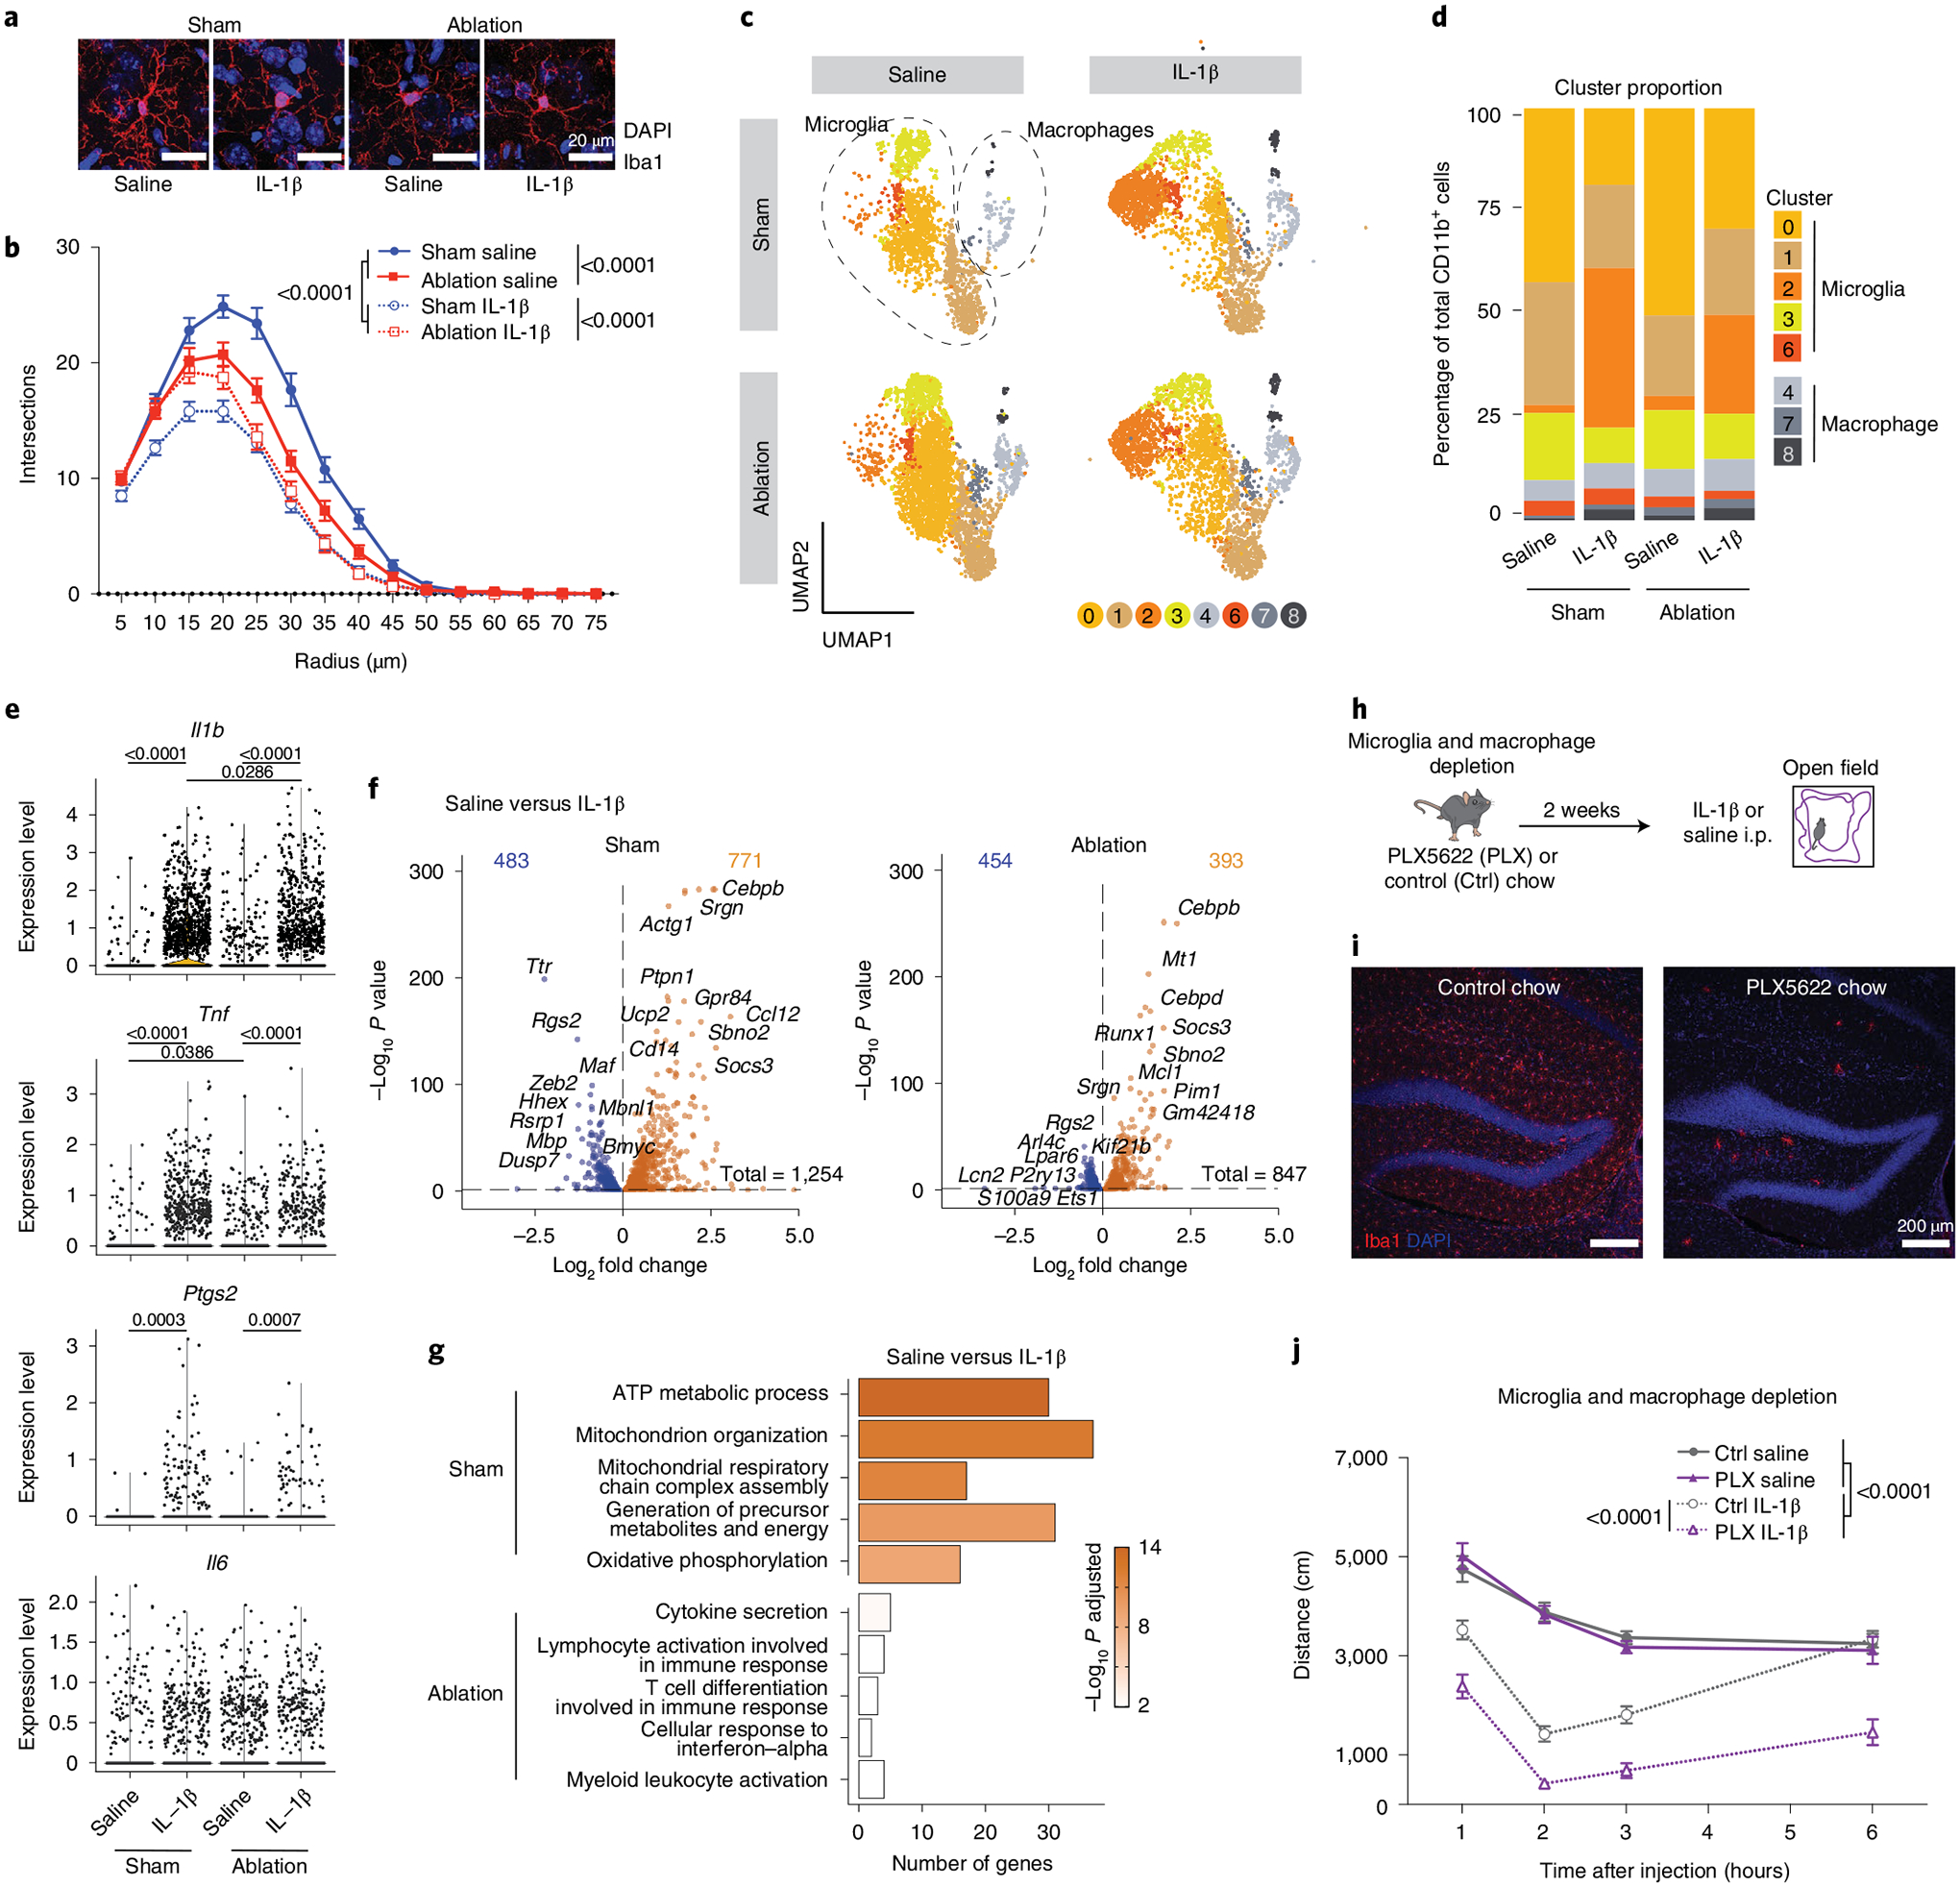
Fig. 2 |. Meningeal lymphatic ablation worsens sickness behavior through microglia.

a, Representative confocal images of brain sections stained for Iba1 (red) and 4,6-diamidino-2-phenylindole (DAPI, blue) 2 h following IL-1β or saline injection comparing photoactivation of Visudyne (ablation) or aCSF (sham) injected 3-month-old mice. Scale bars, 20 μm. b, Sholl analysis of microglia complexity for each condition (n = 45 cells from three mice per group). c–g, Transcriptomes of enriched CD11b+ brain cells from ablation (Visudyne with photoactivation)- and sham (aCSF with photoactivation)-treated mice, 2 h after IL-1β or saline injection, as analyzed by single-cell RNA sequencing (n = 5 mice per group). c, Uniform manifold approximation and projection (UMAP) illustrating microglia and macrophages split by experimental conditions (clusters 5, 9 and 10 were removed and are identified in Extended Data Fig. 3). d, Representation of microglia and macrophage cluster proportions for each condition (n = 5 mice per group). e, Violin plots showing normalized transcript counts of the expression of Il1b, Tnf, Ptgs2 and Il6 in microglia (clusters 0, 1, 2, 3 and 6 combined). f, Volcano plots depicting significantly downregulated (blue) and upregulated (orange) genes between saline and IL-1β treatments for sham- and ablation-treated mice. g, Top five upregulated gene ontology terms enriched in sham (out of 302 total) and ablation (out of 42 total) in response to IL-1β by lowest adjusted P value. h–j, Experimental scheme for microglia and macrophage depletion strategy using PLX5622 (PLX) chow for 2 weeks. i, Representative confocal images of brain sections stained for Iba1 and DAPI. Scale bars, 200 μm. j, Exploratory activity of microglia- and macrophage-depleted and control mice following IL-1β or saline i.p. injection (n = 8 male mice per group). Data in panels b and j presented as mean ± s.e.m. b, j, Three-way AVOVA. d, Two-proportion Z-test to compare the percentage in cluster 2. e,f, Differently expressed genes were identified using a two-tailed F-test with adjusted degrees of freedom based on weights calculated per gene with a zero-inflation model. g, One-tailed Fisher’s exact test. d–g, P value adjustment with Benjamini–Hochberg. b, h–j, the experiments were repeated in duplicates, and one experimental set of data is presented. Data in panels c–g resulted from a single experiment.
