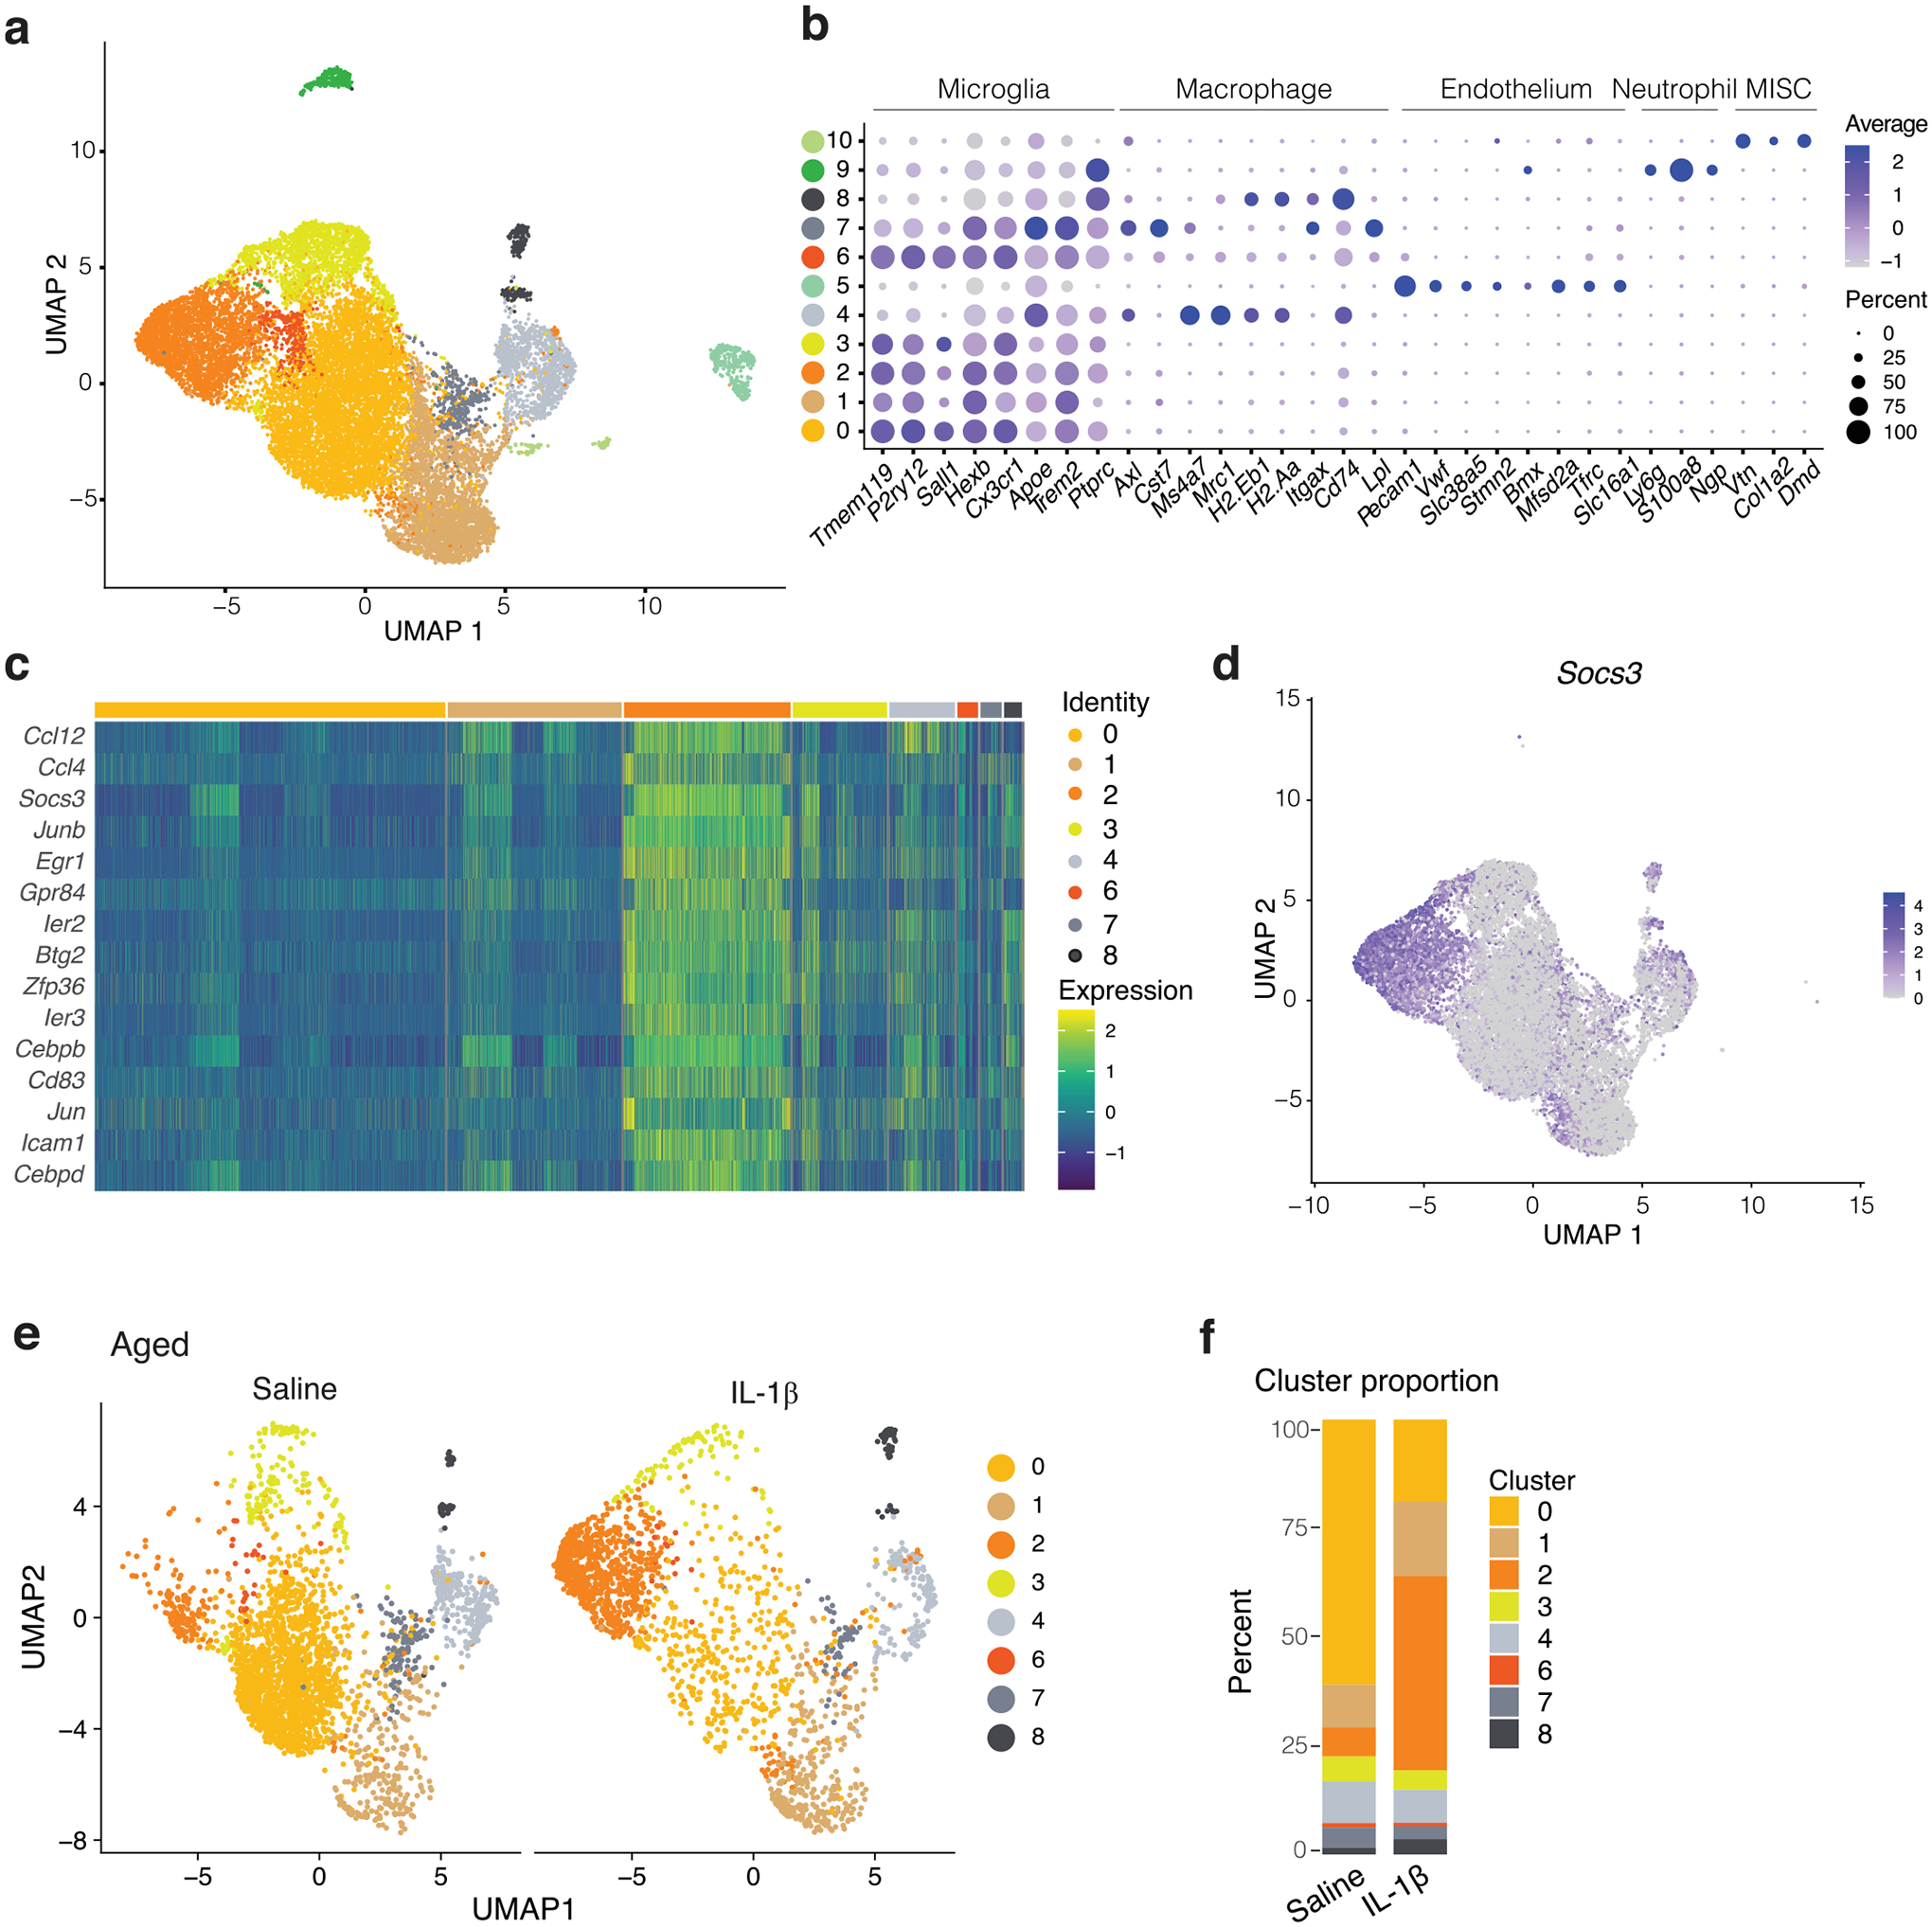
Extended Data Fig. 3 |. Gene expression analysis by single-cell sequencing of microglia after IL-1β induced sickness.

a, UMAP representation for brain CD11b+ cells highlighting the different clusters with and without lymphatic ablation and injected with saline or IL-1β. b, Dot plot of cell type marker expression by cluster. c, Heatmap of mean expression of genes used to define inflammatory microglia. d, Features plot depicts the distribution of Socs3 expression. e, UMAP representation of CD11b+ sequenced cells from 24-month-old aged mice 2 h following saline or IL-1β i.p. injection. f, Cluster distribution compared between saline and IL-1β treatment.
