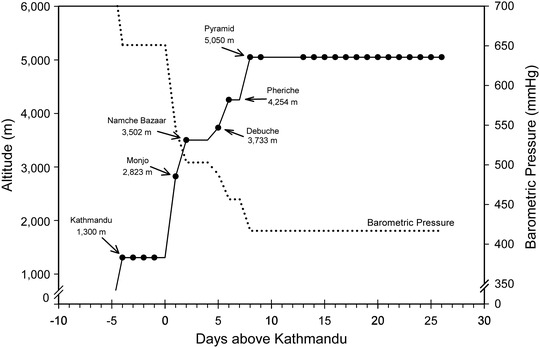
FIGURE 1.

Ascent profile for the expedition showing testing sites and times by the filled circles on the continuous ascent profile line. Also shown is the barometric pressure (dotted line) during the ascent. Filled circles denote times and altitudes where echocardiographic measurements were obtained
