
FIGURE 2.
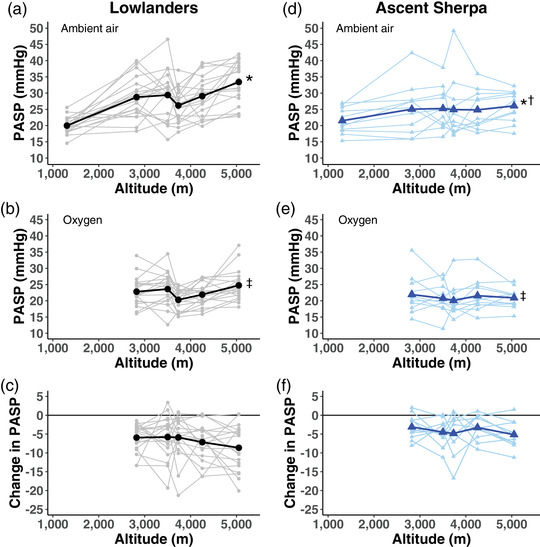
Time course of changes in PASP across altitude among lowlanders and ascent Sherpa. Larger bold symbols represent the mean values with the individual data points in lighter symbols. All values are in mmHg. (a) Ambient air PASP in lowlanders. (b) PASP breathing supplemental oxygen in lowlanders. (c) Change in PASP from ambient air to supplemental oxygen in lowlanders. (d) Ambient air PASP in Ascent Sherpa. (e) PASP breathing supplemental oxygen in ascent Sherpa. (f) Change in PASP from ambient air to supplemental oxygen in ascent Sherpa. *Significant increase in PASP with increasing altitude, P < 0.001. †Significant interaction between altitude and ancestry, P < 0.003. ‡Significant reduction in PASP following oxygen administration, P < 0.001. PASP, pulmonary artery systolic pressure