
FIGURE 4.
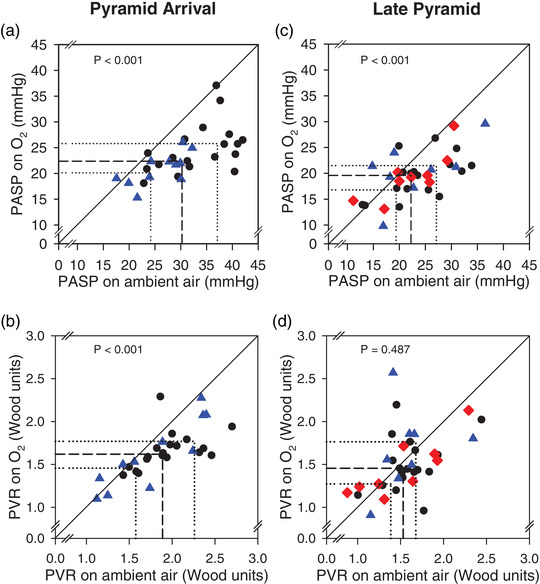
Individual data for PASP and PVR on ambient air and on supplemental oxygen on arrival to the Pyramid Laboratory (a, b) and after ∼2 weeks additional acclimatization at 5050 m (c, d). Circles are lowlanders, triangles are ascent Sherpa, and diamonds are non‐ascent Sherpa. Continuous diagonal lines show the line of identity (no change with oxygen). Dashed lines show the median values with the thin dotted lines showing the 25th percentile and 75th percentile. P‐values reflect the paired comparison on and off supplemental oxygen