FIGURE 1.

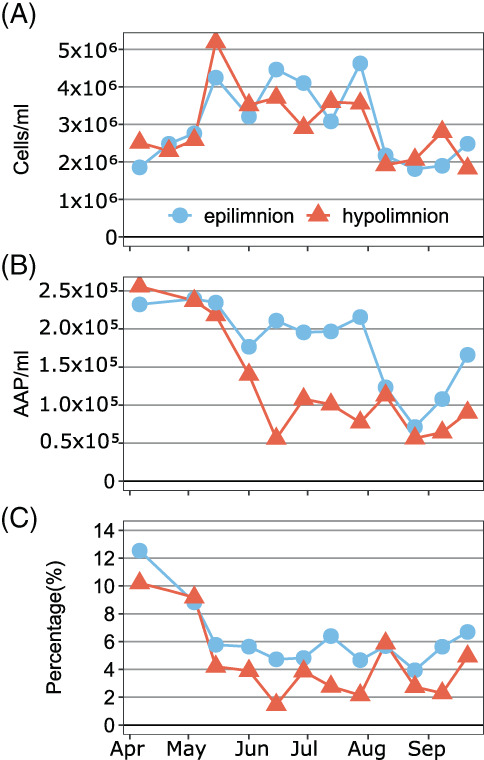
Weekly abundances of all prokaryotes (A), AAP bacteria (B) and relative abundance of AAP bacteria in the total bacterial community (C) in the epilimnion (blue‐circles and line) and the hypolimnion (red‐triangles and line) of Cep lake.

Weekly abundances of all prokaryotes (A), AAP bacteria (B) and relative abundance of AAP bacteria in the total bacterial community (C) in the epilimnion (blue‐circles and line) and the hypolimnion (red‐triangles and line) of Cep lake.