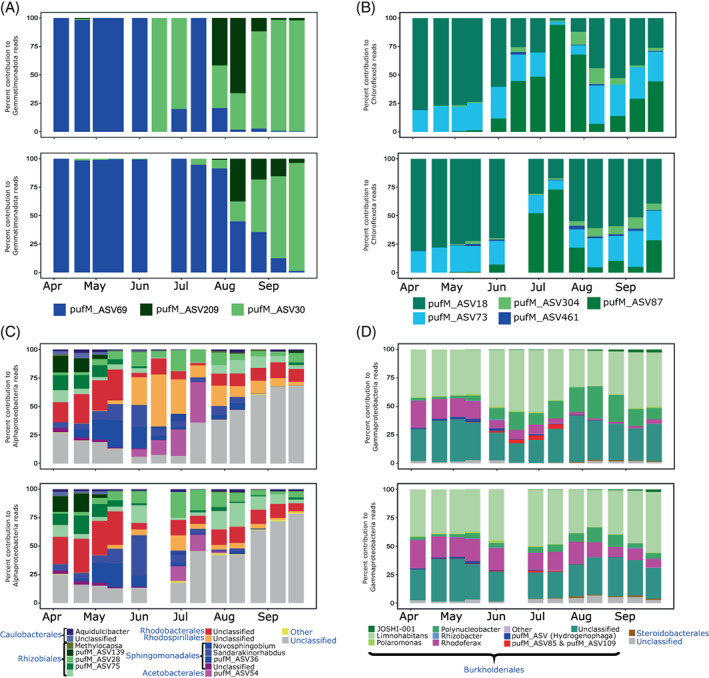
FIGURE 4.

AAP bacteria community composition based on pufM gene amplicon sequencing in the epilimnion (upper plots in each panel) and the hypolimnion (bottom plots) in Cep lake. (A) Percent contribution of ASVs affiliated with Gemmatimonadota to the number of reads coming from Gemmatimonadota; (B) percent contribution of ASVs affiliated with Chloroflexota to the number of reads coming from Chloroflexota, (C) percent contribution of alphaproteobacterial genera and ASVs to the number of reads coming from Alphaproteobacteria and (D) percent contribution of gammaproteobacterial genera and ASVs to the number of reads coming from Gammaproteobacteria.
