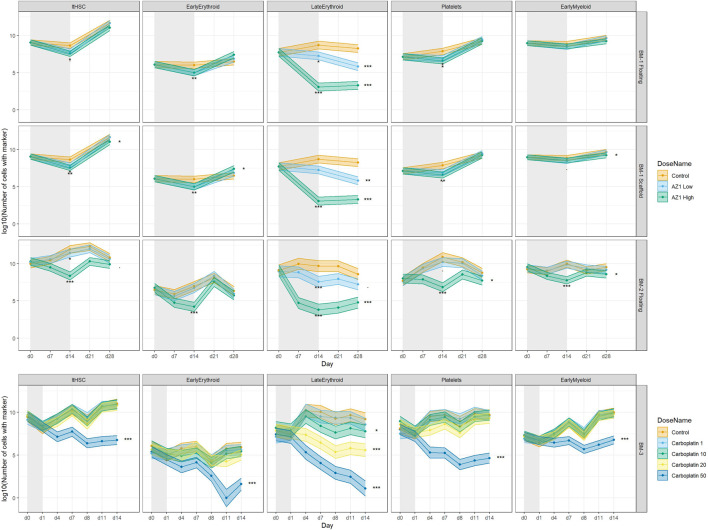
FIGURE 7.
Treatment-induced lineage-specific toxicity. The effect of treatment with AZ1 or carboplatin on different haematopoietic lineages over time in BM-1, BM-2 or BM-3 studies. The shaded regions represent the dosing period in each case. Stars represent the results of the significance tests, at both the end of the dosing period and the end of the recovery period for each drug (note that carboplatin showed no significant effects at the end of the dosing period), Significance values are (<0.1), * (p < 0.05), ** (p < 0.01), *** (p < 0.001).

