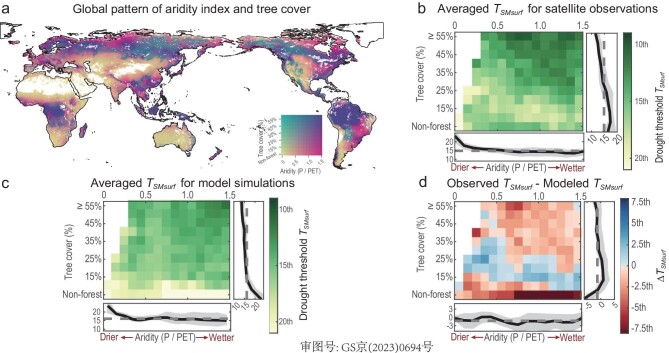
Figure 3.
Patterns of drought threshold (TSMsurf) along the gradients of aridity and tree cover. (a) Map for different levels of aridity (horizontal axis of the color palette) and fractions of tree cover (vertical axis of the color palette). (b) Main panel: variation in averaged drought thresholds derived from satellite observations as a function of different levels of the aridity index measured by mean annual P/PET (x-axis) and the fraction of tree cover (y-axis). Non-forest is defined as <1% of tree cover. Right: change in drought thresholds along the fraction of tree cover for the means (line) and variations (shaded areas) across all levels of aridity (0–1.5). Lower: change in drought thresholds along the aridity index for the means (line) and variations (shaded areas) across all ranges of tree cover. Drier areas are denoted by smaller values of the aridity index and vice versa. Smaller percentiles of thresholds indicate that a higher drought stress level should be reached to cause a pronounced vegetation response. (c) Same format as for (b), but the variation in average drought thresholds is derived from model simulations. (d) Same format as for (b), but the difference is between satellite observations and model simulations. The positive and negative values suggest the underestimation and overestimation of drought thresholds by model simulations, respectively.

