
FIGURE 1.
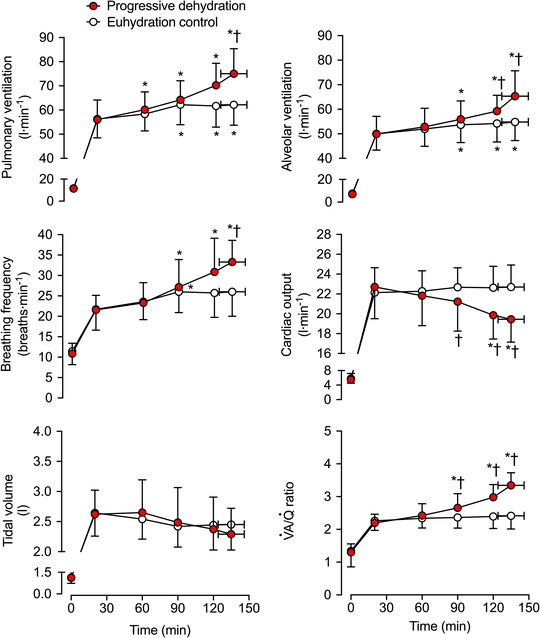
Ventilatory, respiratory and perfusion responses during prolonged intense exercise with varied hydration status. Pulmonary ventilation, breathing frequency, tidal volume, alveolar ventilation (), cardiac output () and / ratio during the progressive dehydration and euhydration control trials. Data are shown as the mean ± SD for seven subjects, except for and /, where data are from six subjects. *Significantly different from 20 min, P < 0.05. †Significantly different from euhydration control, P < 0.05