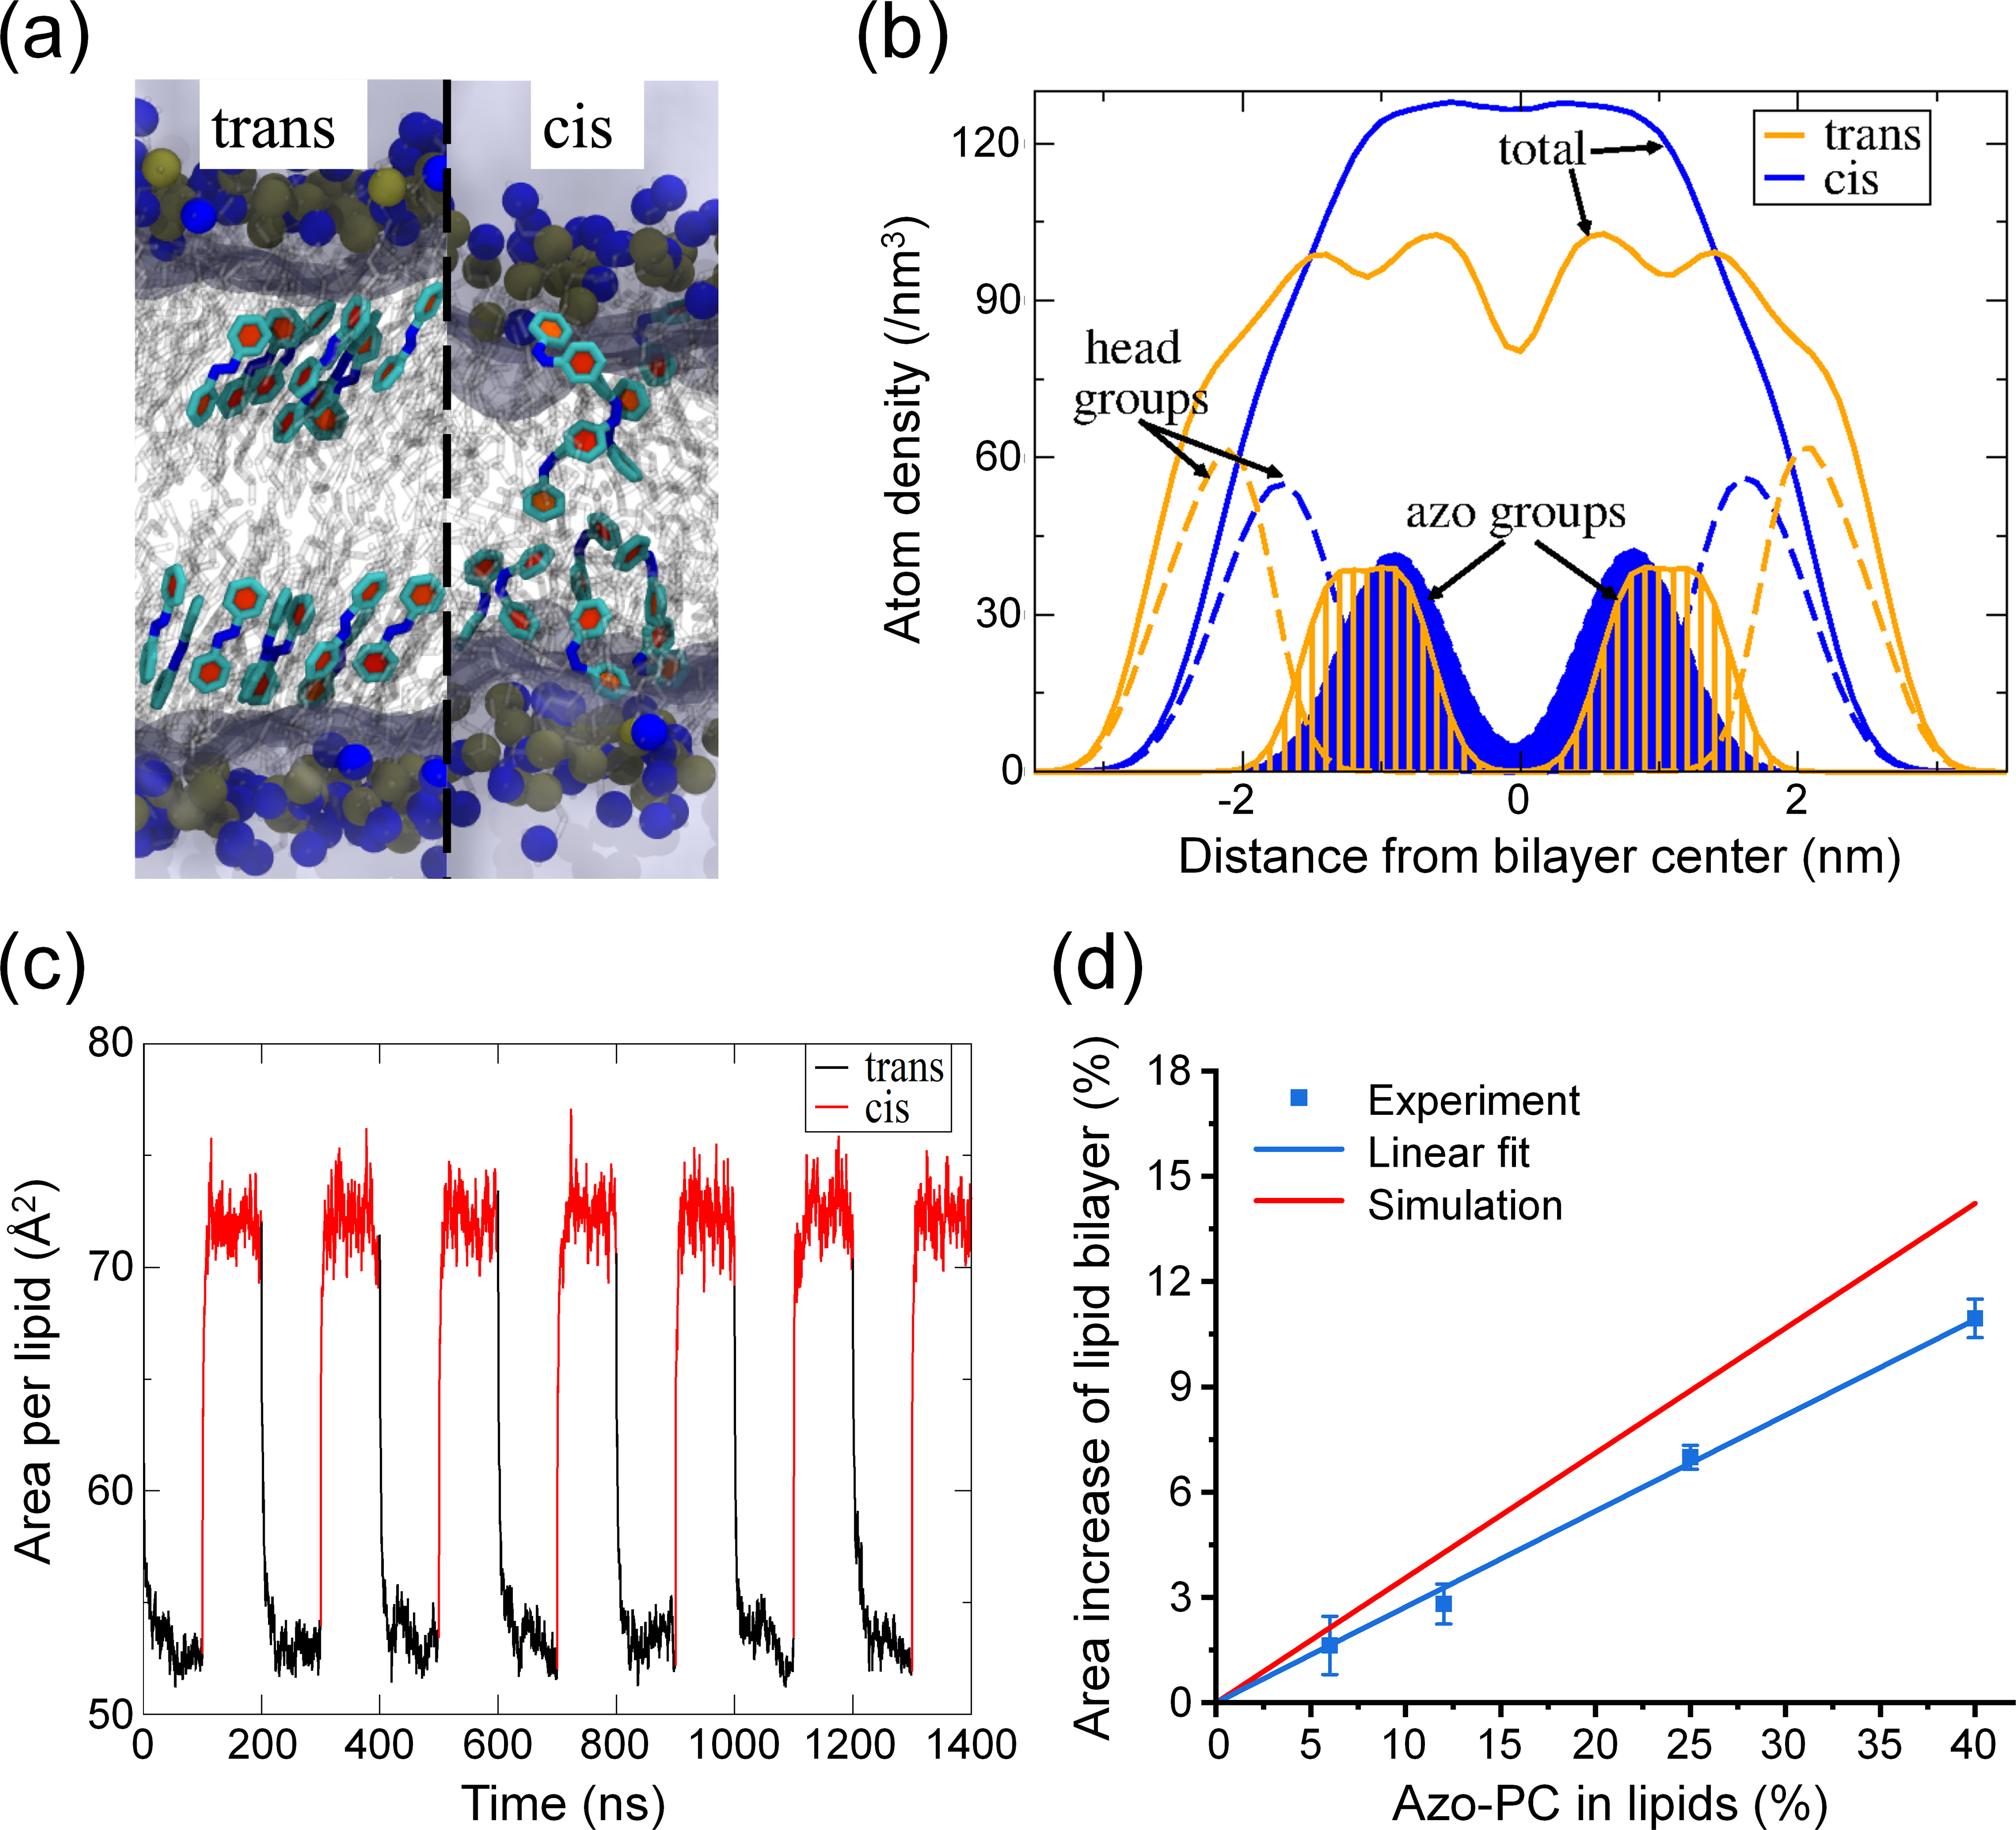
Figure 2.

Molecular dynamics simulation for azo-PC lipid bilayer. (a) Snapshots of the trans and cis bilayers. Selected azobenzene groups are highlighted in light cyan with the ring planes in red. Lipid tails are shown in transparent gray. The blue and brown spheres represent nitrogen and phosphorous atoms on the head group, respectively. Water is represented as light purple regions. (b) The lipid atom density profile of the azo-PC bilayer as a function of the distance from the bilayer center. The orange and blue lines represent the trans-azo-PC and cis-azo-PC bilayers. Solid lines: the overall lipid density; dashed lines: lipid head groups; shaded regions: azobenzene groups. (c) Area per lipid in the tensionless ensemble of the azo-PC bilayer when the isomeric state of every lipid is altered between cis and trans every 100 ns. (d) Experimental and simulated azosome area increase with different percentages of azo-PC after the irradiation with 365 nm light (25 mW/cm2, 30 s). Data are expressed as mean ± standard deviation (S.D.) Simulation data were extrapolated to 0% azo-PC from the data in (c).
