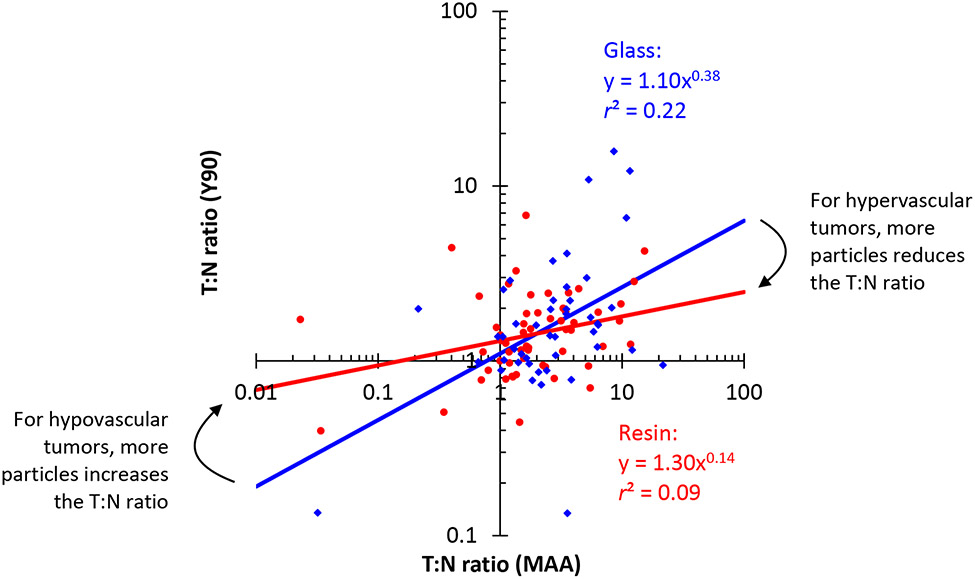
Figure 3.
The T:N ratio changes as more particles are delivered. Glass microspheres show a greater correlation between T:N ratio on 99mTc-MAA SPECT/CT and post-90Y bremsstrahlung SPECT/CT, compared to resin. Each point represents 1 patient. The blue points (♦) and regression line show results for glass microspheres, and the red points (•) and regression line show results for resin microspheres (power law regression on a log-log plot). The regression lines for glass versus resin microspheres have different exponents (p=0.04). The differences in T:N ratios can be explained by the particle flow model in Supplemental Materials.

