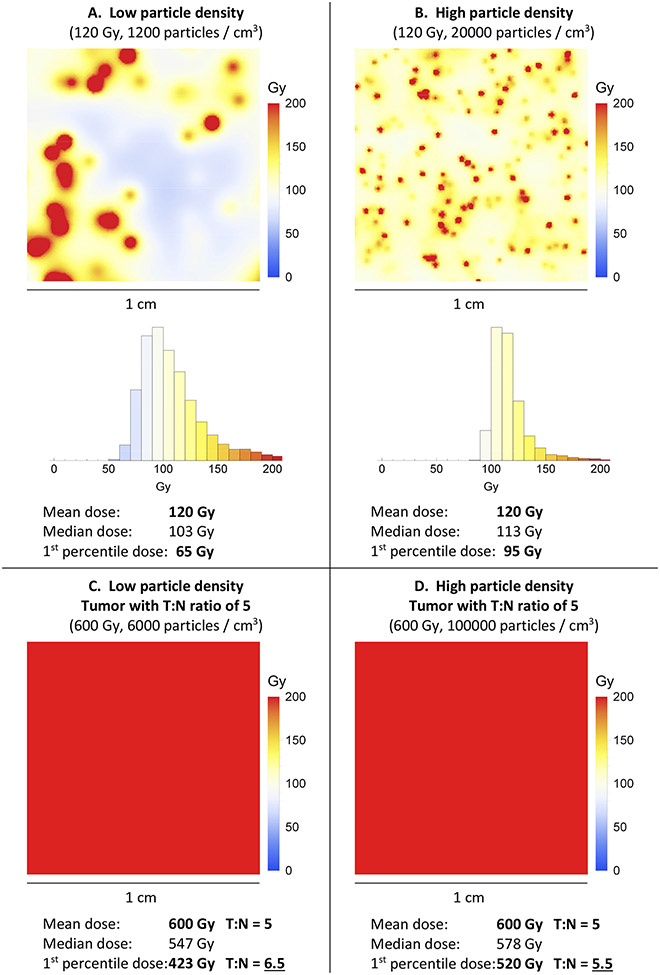
Figure 4.
A and B: Microdosimetry maps (1×1 cm) showing 120 Gy (mean dose), achieved using low versus high particle density. Although the mean dose is the same in both microdosimetry maps, the dose distribution is not the same. With low particle density, there are cold spots between particles. C and D: Corresponding microdosimetry heat maps and doses in a homogeneous hypervascular tumor, with a T:N ratio of 5 (which means 5 times the mean dose, and 5 times the particle density). In this example, for both low and high particle density, the dose is uniformly therapeutic throughout the tumors.

