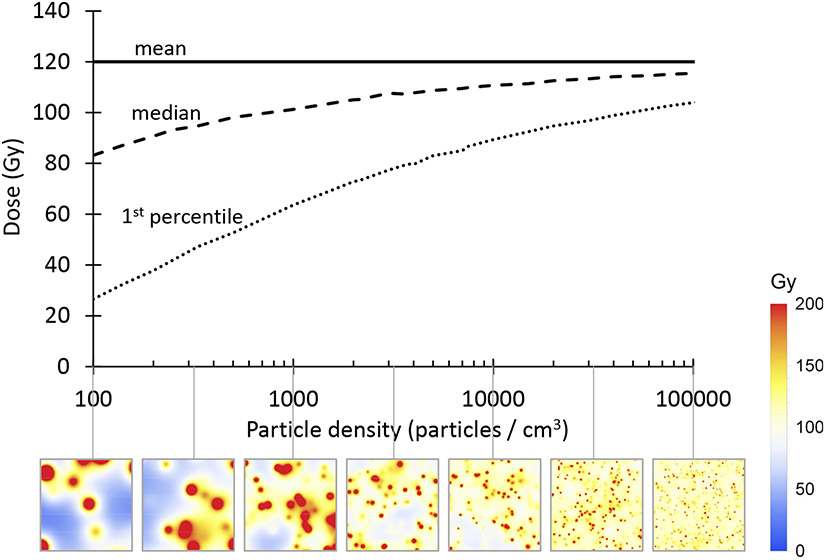
Figure 5.
Mean, median, and 1st percentile doses, as a function of particle density, with corresponding microdosimetry maps (1×1 cm). Cold spots are seen between particles when the particle density is low. The 1st percentile tumor dose was a better predictor of LPFS and overall survival than the mean tumor dose.

