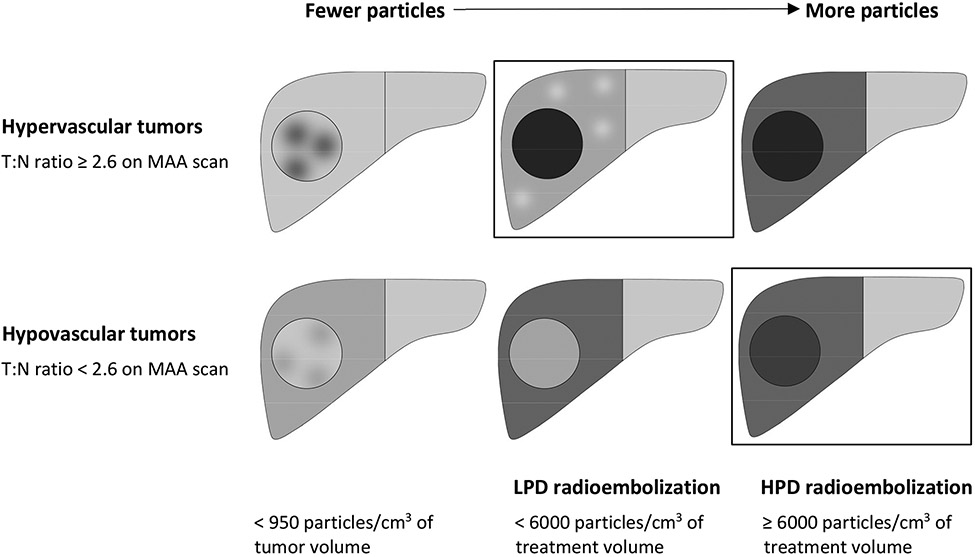
Figure 6.
The particle distribution changes as more particles are delivered. Boxes are drawn around the ideal embolization endpoints, which maximize the tumor dose and minimize the liver dose. Darker shading indicates higher particle density. For hypervascular tumors, enough particles should be delivered to fill up the tumor, but embolization should be stopped when particles start to flow mostly to liver. For hypovascular tumors, more particles can be needed to overcome the poor tumor vascularity. Using the optimal particle density resulted in improved local progression free survival and improved overall survival, compared to using suboptimal particle density. Particle density and T:N ratio cutoffs in this figure are based on data from Figure 2 and Supplemental figure 1.

