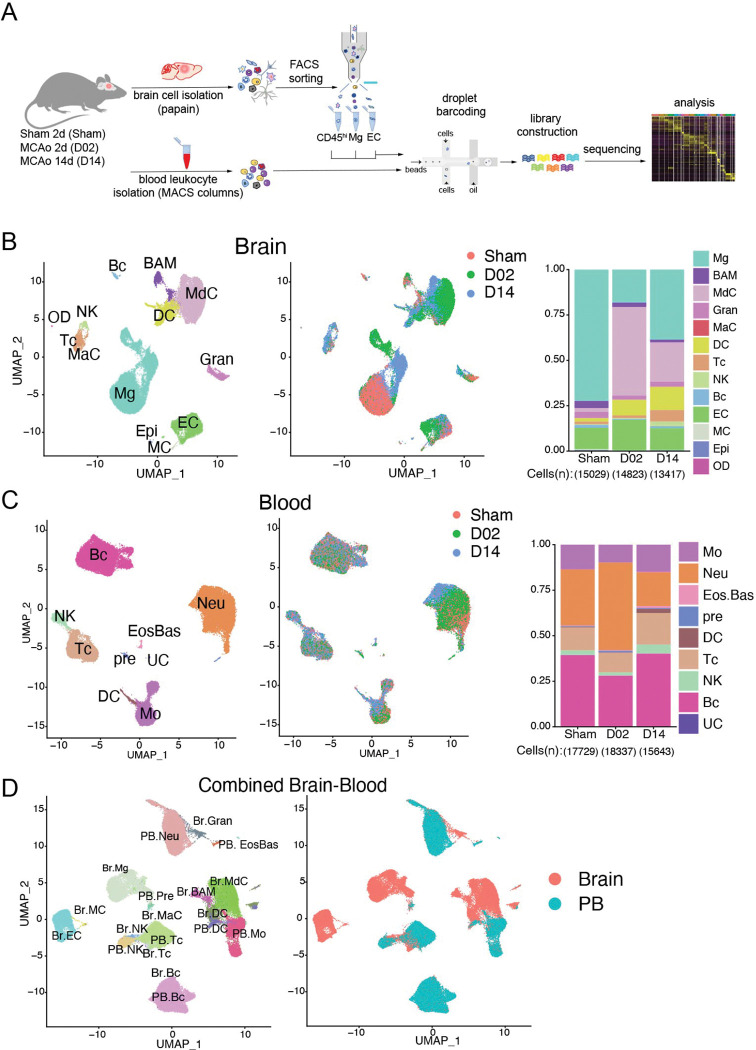
Figure 1. Single-cell transcriptomic profiling of mouse brain and blood cells after transient focal cerebral ischemia.
(A) Schematic representation of Drop-Seq scRNA-seq pipeline used to analyze brain and blood cells isolated from either control surgery (Sham) or stroke mice 2 and 14 days (D02, D14) after injury. Brain cells were dissociated by enzymatic digestion with papain. Infiltrating leukocytes (CD45hi), microglia (Mg) and endothelial cells (EC) were isolated by flow cytometry sorting. Blood leukocytes were purified after erythrocyte removal. Brain and blood single cell suspensions were subjected to Drop-Seq, sequencing and analysis.
(B, C) Left: Uniform Manifold Approximation and Projection (UMAP) plot representing color-coded cell clusters identified in merged brain (B) or blood (C) single-cell transcriptomes; Middle: UMAP of 3 color-coded time point overlay of brain (B) or blood (C) single-cell transcriptomes; Right: bar graph showing relative frequencies of each cell type across Sham, D02 and D14 groups of either brain (B) or blood (C) identified cell type clusters.
(D) Left: UMAP plot of the combined brain (Br) and blood (PB) dataset showing cell clustering similarities between brain and blood Gran, Tc, Bc and brain myeloid cells (BAM, MdC, DC) with blood monocytes (left). Left: UMAP plot shows the distribution of brain and blood cells overlying the identified clusters. Border-associated macrophages (BAM), monocyte-derived cells (MdC), granulocytes (Gran), mast cells (MaC), dendritic cells (DC), T cells (Tc), NK cells (NK), B cells (Bc), vascular mural cells (MC), epithelial-like cells (Epi), oligodendrocytes (OD); Eosinophils-Basophils (EosBas); Monocytes (Mo); hematopoietic precursors (pre); unclassified (UC).

