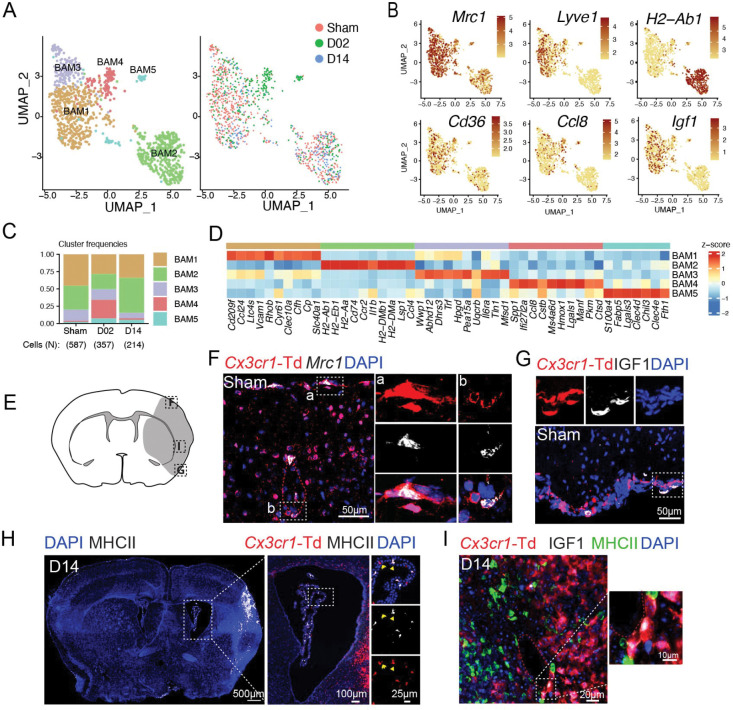
Figure 3. Transcriptional changes of border-associated macrophages (BAM) after stroke.
(A) Left: UMAP analysis of merged Sham, D02 and D14 BAM transcriptomes discloses 5 subclusters; Right: UMAP of overlaid time points shows overlap of clusters among Sham, D02 and D14 groups, except for BAM4, which is confined to D02.
(B) UMAP plots depicting expression of individual marker genes for BAM (Mrc1, Cd36), meningeal and perivascular BAM (Lyve1), choroid plexus BAM (H2-Ab1) and activated meningeal and perivascular BAM (Ccl8, Igf1). Scale bar represents log of normalized gene expression.
(C) Bar graph showing relative frequencies of BAM subclusters across Sham, D02 and D14 groups.
(D) Heatmap displaying expression of the top 10 upregulated genes in each BAM cluster. Scale bar represents Z-score of average gene expression (log).
(E) Graphical representation of brain coronal section indicating anatomical regions where images F-I were acquired.
(F) RNAscope in situ hybridization fluorescence (FISH) combined with immunofluorescence (IF) images of brain cortical areas showing Mrc1 expression (white) in resident macrophages (Td+, red) on the brain surface and around vessels of Cx3cr1-Td+ mice 2 days after Sham surgery (Sham). Nuclei are stained with DAPI (blue).
(G, I) IF images validating IGF1 (white) expression by pial BAM (Td+, red) (G) in Sham Cx3cr1-Td+mice and in perivascular macrophages (PVM) (I) of the ischemic brain at D14 (Middle and left).
(H) Left: Representative IF image of a whole brain section from a Cx3cr1-Td+ mouse subjected to 14 days of MCA occlusion (D14), showing MHCII+ cells (white, binary mask) localization and nuclear DAPI staining (blue); Right: IF images of magnified areas of the choroid plexus (ChP) showing MHCII expression (white) by ChP macrophages (Td+, red).

