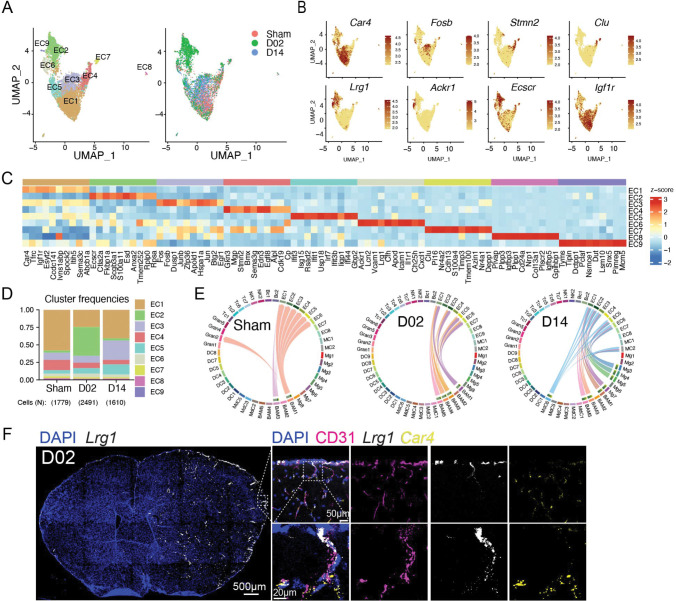
Figure 5. Endothelial cell (ECs) transcriptional changes and Igf1r signaling after stroke.
(A) Left: UMAP analysis of merged Sham, D02 and D14 EC transcriptomes discloses 9 subclusters; Right: UMAP of overlaid time points shows dissociation of EC2 cluster at D02 and general overlap of all the other clusters across Sham, D02 and D14 groups.
(B) UMAP plots depicting single-cell gene expression of individual marker genes for capillary (Car4, Fosb), arterial (Stmn2, Clu) and venular (Lrg1, Ackr1) ECs and for the endothelial receptors Ecscr and Igf1r. Scale bar represents log of normalized gene expression.
(C) Heatmap displaying scaled differential expression of the top 10 upregulated genes in each EC cluster. Scale bar represents Z-score of average gene expression (log).
(D) Bar graph showing relative frequencies of EC subclusters across Sham, D02 and D14 groups.
(E) Chord plots showing CellChat inferred ligand-receptor interactions between Igfr1 and Igf1 in Sham, D02 and D14 stroke mice. The strength of the interaction is indicated by the edge thickness. The color of the chord matches the cell cluster color sending the signal (Igf1). The number of cell cluster receptors (Igfr1), and their weight in the interactions, is indicated by the color-matched stacked bar next to each sender cluster.
(F) RNAscope in situ hybridization fluorescence (FISH) combined with immunofluorescence (IF) of Lrg1. Left: Overview of Lrg1 expression (binary mask, white) in a whole brain section co-stained for DAPI (blue), showing high upregulation of Lrg1 in the ischemic hemisphere Right: magnified images of brain cortical areas showing Lrg1 (white) colocalization with the EC marker CD31 (magenta) but not with the capillary marker Car4 (yellow). Nuclei are stained with DAPI (blue).

