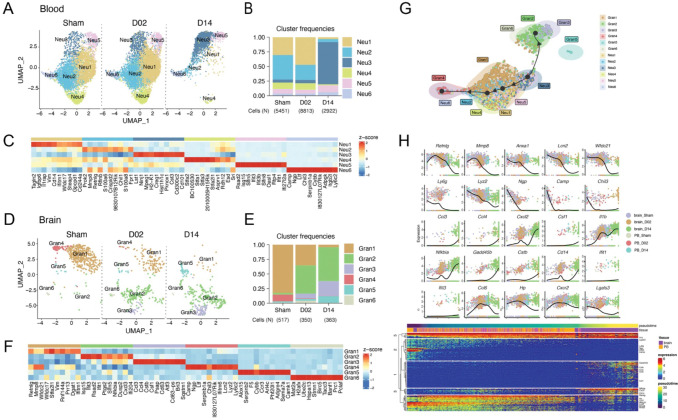
Figure 6. Granulocyte transcriptional changes through ischemia-reperfusion.
(A, D) UMAP plots of peripheral blood neutrophil (Neu) (A) and brain granulocyte (Gran)(C) transcriptomes by studied time point: control surgery or stroke mice 2 or 14 days after injury (Sham, D02, D14). Six clusters were identified in each data set (Neu1-6; Gran1-6).
(B, E) Bar graph showing relative frequencies of peripheral blood Neu (B) and brain Gran (D) clusters across Sham, D02 and D14 groups.
(C, F) Heatmap displaying scaled differential expression of the top 10 upregulated genes in each peripheral blood Neu (E) and brain Gran (F) clusters. Scale bar represents Z-score of average gene expression (log).
(G) Slingshot trajectory of combined peripheral blood neutrophils (Neu) and brain granulocytes (Gran) showing predicted cluster transition. Each point is a cell and is colored according to its cluster identity. The analyses point out transcriptional states changes of blood and brain granulocyte through the ischemic-reperfusion time.
(H) Top: Expression of single gene plotted as a function of pseudotime. Dot plots show expression levels of top cluster genes of combined blood Neu and brain Gran data sets along ischemic-reperfusion pseudotime. Each dot represents the expression levels (log) for each gene in a cell and is colored according to the group. Lines show average expression. Bottom: The top 100 genes that specifically covary with pseudotime were identified using generalized additive models and the log normalized expression values were plotted along the pseudotime axis. The location of genes plotted above is indicated.

