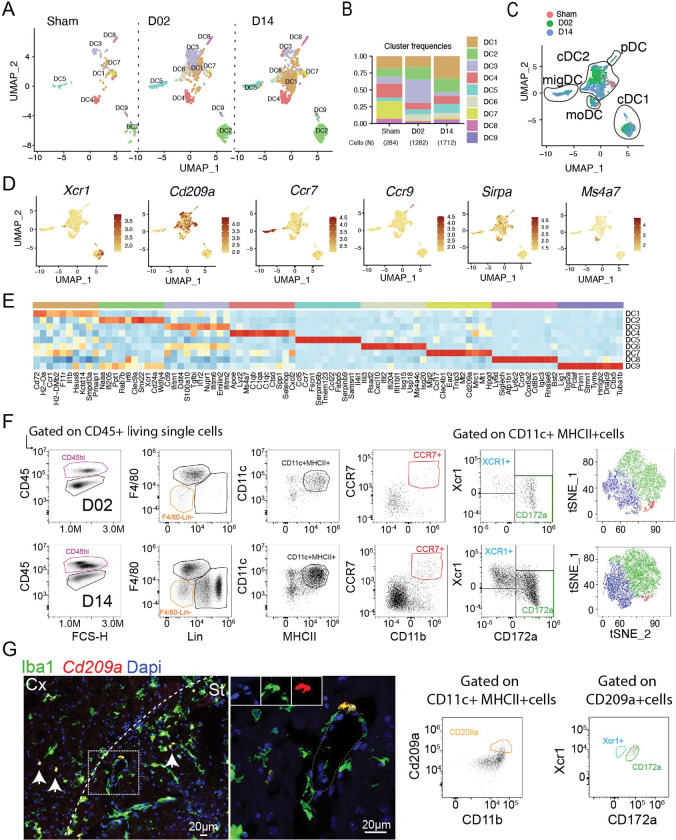
Figure 7. Transcriptional changes in brain dendritic cells.
(A) UMAP plots of brain dendritic cells (DC) transcriptomes for each studied time point identifies 9 clusters ((DC1-9).
(B) Bar graph showing relative frequencies of DC subclusters across Sham, D02 and D14 groups.
(C) UMAP of 3 color-coded time point overlay of brain DC. Classification of the clusters in DC subtypes is -DC (moDC) and plasmacytoid DC (pDC).
(D) UMAP plots displaying expression of marker genes for each identified DC cluster in the brain. Scale bar represents log of normalized gene expression.
(E) Heatmap displaying scaled differential expression of the top 10 upregulated genes in each DC subcluster. Scale bar represents Z-score of average gene expression (log).
(F) Flow cytometry analysis validating brain cDC1 (XCR1+), cDC2 (CD172a+) and migDC (CCR7+) subtypes identified by scRNA-seq after stroke.
(G) Left: FISH of Cd209a (red) expression in the brain, combined with IF for Iba1 (green) and nuclear satining with DAPI, showing Cd209a+Iba1+ cells around the vessels. Cx: cortex; St: striatum. Right: Flow cytometry analysis showing double positive CD209a+CD172a+ cells.

