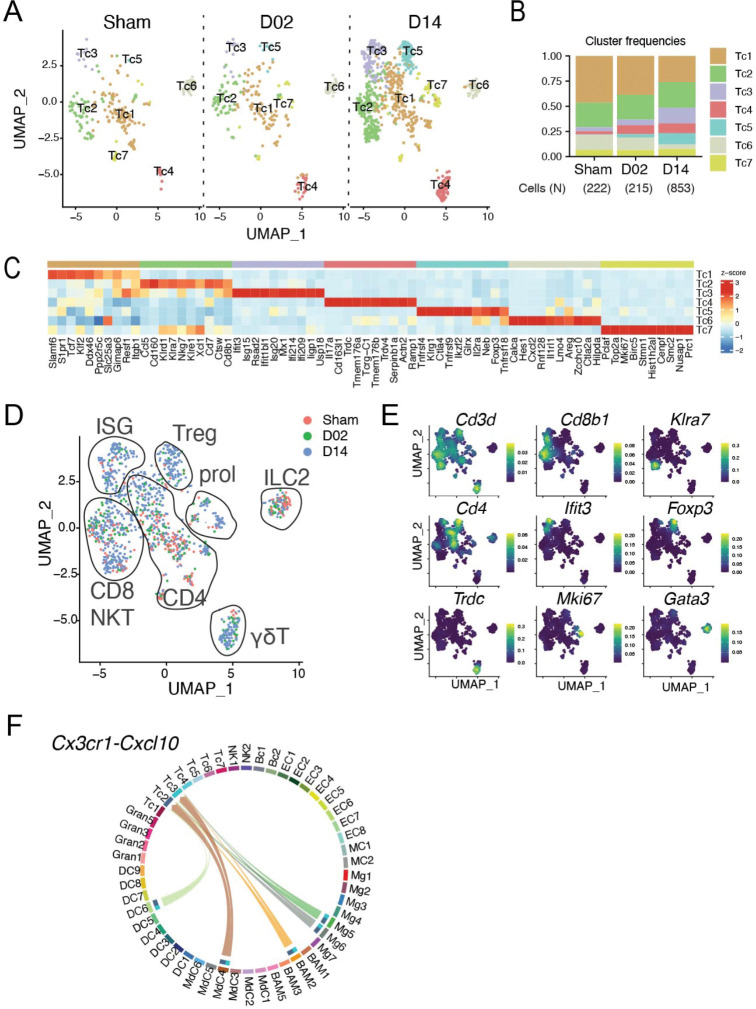
Figure 8. Transcriptional changes in brain lymphoid cells.
(A) UMAP plots of brain lymphoid cells (Tc) transcriptomes for each studied time point identifies 7 clusters (Tc1-7).
(B) Bar graph showing relative frequencies of Tc subclusters across Sham, D02 and D14 groups.
(C) Heatmap displaying expression of the top 10 upregulated genes in each Tc subcluster. Scale bar represents Z-score of average gene expression (log).
(D) UMAP of merged Sham, D02 and D14 Tc transcriptomes depicting identified Tc subtypes in diagrams: CD4, CD8, NKT, ILC2, ISG signature, γδT, Treg and proliferating T cells (prol).
(E) Density plots in the UMAP space showing the expression of selected marker genes used for lymphoid cell type identification. Scale bar represents densities based on kernel density estimation of gene expression.
(F) Chord plot showing cell-cell interactions between Cxcr3 and Cxcl10 in grouped Sham, D02 and D14 stroke mice. The strength of the interaction is indicated by the edge thickness. The color of the chord matches the cell cluster color sending the signal (Cxcl10). The number of cell cluster receptors (Cxcr3), and their weight in the interactions, is indicated by the color-matched stacked bar next to each cluster sender.

