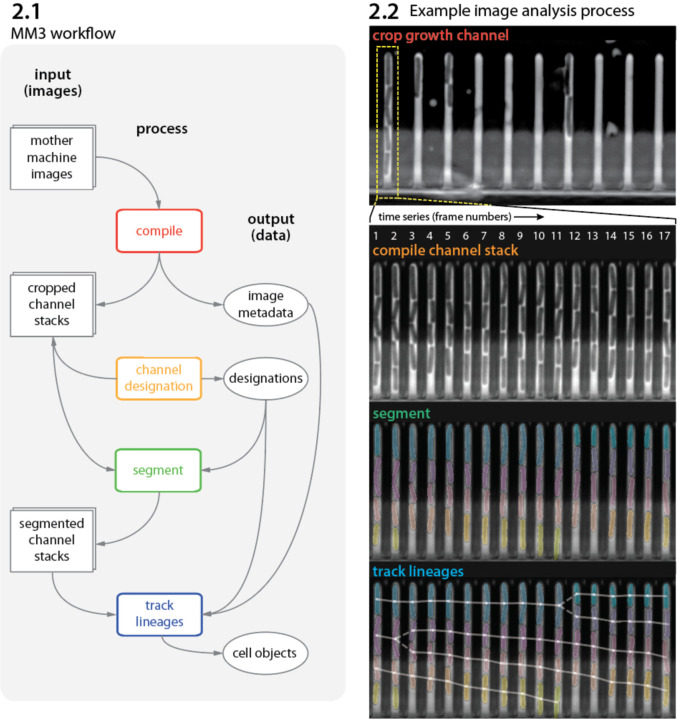
Figure 2: MM3 workflow and example images.
(2.1) The MM3 image analysis pipeline takes raw mother machine images and produces cell objects. Processes (rounded rectangles) are modular; multiple methods are provided for each. (2.2) Example images from the processing of one growth channel in a single FOV. The growth channel is first identified, cropped, and compiled in time. All cells are segmented (colored regions). Lineages are tracked by linking segments in time to determine growth and division (solid and dashed lines, respectively), creating cell objects.

