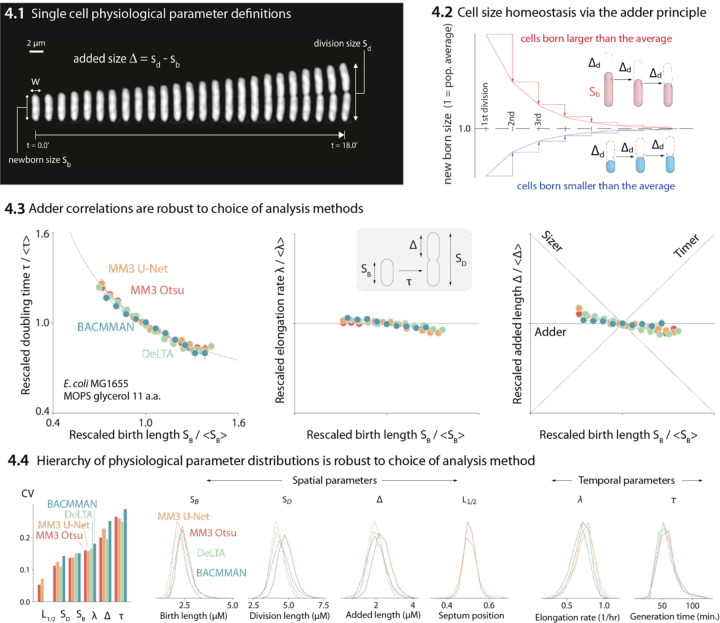
Figure 4: Comparison of various image analysis approaches.
(4.1) A time series of a typical cell growing in a nutrient-rich medium. The birth size, division size, and added size are indicated. (4.2) The adder principle ensures cell size homeostasis via passive convergence of cell size to the population mean. (4.3) We analyzed multiple datasets from our lab using MM3, DeLTA, and BACMMAN, and obtained robust correlations between birth length, doubling time, elongation rate, and added length. Representative results from one dataset [10] for MG1655 background E. coli grown in MOPS glycerol + 11 amino acids are shown, with 9,000 – 13,000 cells analyzed depending on the method. (4.4) Distributions of key physiological parameters are independent of the analysis methods. The data and code used to generate this figure are available at [46]

