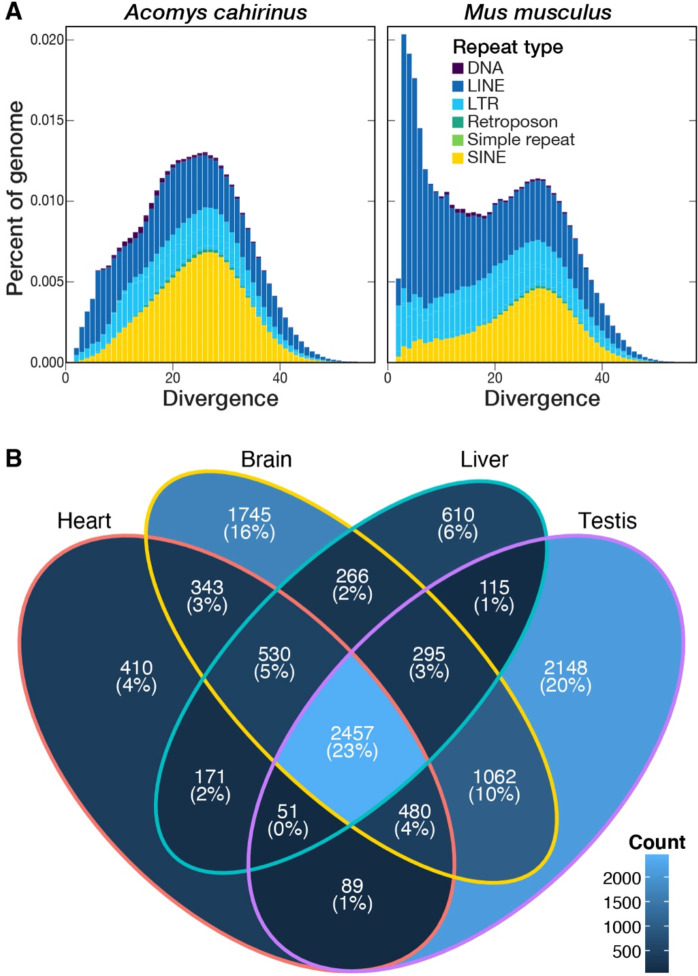
Figure 2.
(A) Repeat landscapes for Acomys cahirinus and Mus musculus, visualizing the percent of each genome comprised of different types of repeats according to their divergence from family consensus (DNA, DNA transposon; LINE, long interspersed nuclear element; LTR, long terminal repeat retrotransposon; SINE, short interspersed nuclear element). (B) Venn diagram showing the number of genes per tissue with an RPKM value greater than 1. The majority of genes (2,457; 23%) are expressed at this level in all four tissues, while testis had the highest number of genes (2,148; 20%) with an RPKM greater than 1 not seen in other tissues.

