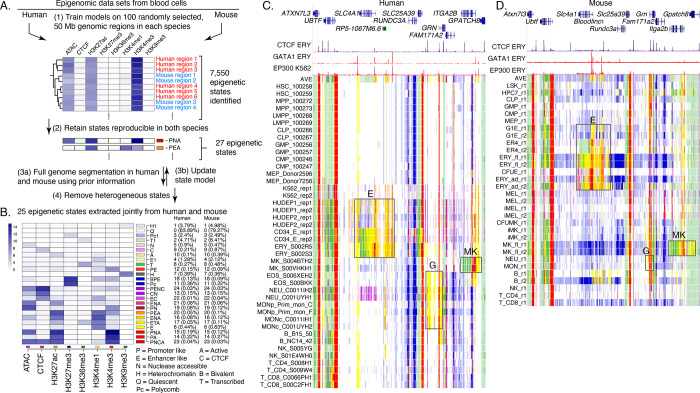
Figure 2. Genome segmentation and annotation jointly between human and mouse using IDEAS.
(A) Workflow for joint modeling. (1) Initial epigenetic states from 100 randomly selected regions separately in human and mouse hematopoietic cell types were identified in IDEAS runs. (2) States that were reproducible and shared in both species (see Methods) were retained. (3a and 3b) The profile of epigenetic feature contribution to each of the reproducible states was sequentially refined by applying IDEAS across the full genomes of human and of mouse, updating the state model after each IDEAS run. (4) Two heterogeneous states were removed to generate the final joint epigenetic states in the two species. (B) The 25 joint epigenetic states for human and mouse hematopoietic cell types. The average signal of the epigenetic features for each state are shown in the heatmap. The corresponding state colors, the state names based on the function, and the average proportions of the genome covered by each state across cell types are listed on the right-side of the heatmap. (C) Annotation of epigenetic states in a large genomic interval containing SLC4A1 and surrounding genes across human blood cell types. The genomic interval is 210kb, GRCh38 chr17:44,192,001–44,402,000, with gene annotations from GENCODE V38. Binding patterns for selected transcription factors are from the VISION project ChIP-seq tracks (CTCF and GATA1 in adult erythroblasts, signal tracks from MACS, track heights 100 and 80, respectively) or from the ENCODE data portal (EP300 in K562 cells, experiment ENCSR000EGE, signal track is fold change over background, track height is 50). The epigenetic state assigned to each genomic bin in the different cell types is designated by the color coding shown in panel (B). The replicates in each cell type examined in Blueprint are labeled by the id for the donor of biosamples. Genes and regulatory regions active specifically in erythroid (E), granulocytes (G), and megakaryocytes (MK) are marked by gray rectangles. (D) Annotation of epigenetic states in a large genomic interval containing Slc4a1 and surrounding genes across mouse blood cell types. The genomic interval is 198kb, mm10 chr11:102,290,001–102,488,000, with gene annotations from GENCODE VM23. Binding patterns for selected transcription factors are from the VISION project ChIP-seq tracks (CTCF in adult erythroblasts, GATA1 and EP300 from the highly erythroid fetal liver, signal tracks from MACS, track heights 200, 200, and 150, respectively; the EP300 track was made by re-mapping reads from ENCODE experiment ENCSR982LJQ). The tracks of epigenetic states and highlighted regions are indicated as in panel (C).

