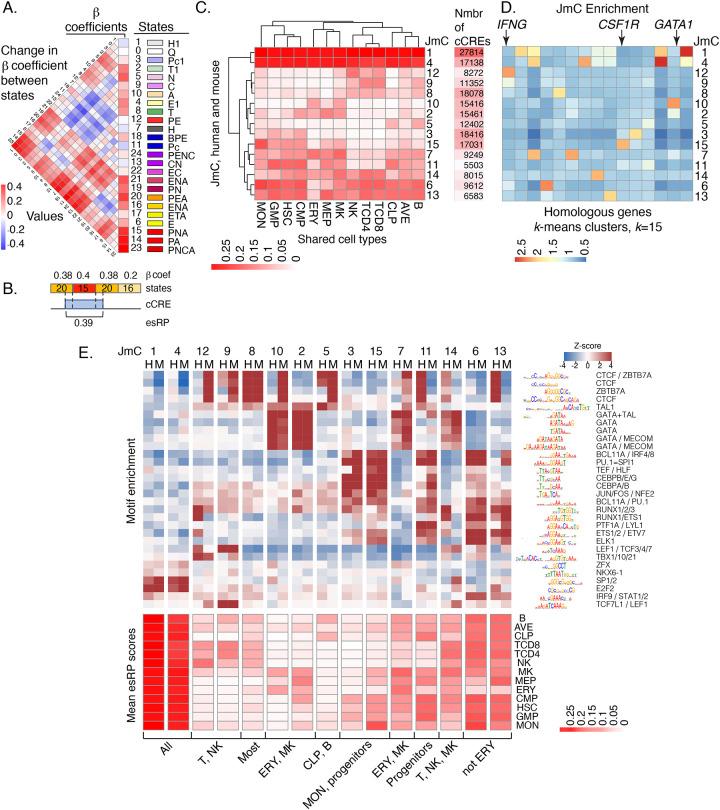
Figure 4. Beta coefficients of states, esRP scores of cCREs, joint human-mouse metaclusters of cCREs based on esRP scores, and enrichment for TFBS motifs.
(A) Beta coefficients and the difference of beta coefficients of the 25 epigenetic states. The vertical columns on the right show the beta coefficients along with the ID, color, and labels for the 25 joint epigenetic states. The triangular heatmap shows the difference of the beta coefficients between two states in the right columns. Each value in the triangle heatmap shows the difference in beta coefficients between the state on top and the state below based on the order of states in the right columns. (B) An example of calculating esRP score for a cCRE in a cell type based on the beta coefficients of states. For a cCRE covering more than one 200bp bin, the esRP equals the weighted sum of beta coefficients of states that covers the cCRE, where the weights are the region covered by different states. (C) The average esRP score of all cCREs in JmCs across blood cell types shared by human and mouse. The right column shows the number of human cCREs in each JmC. (D) The average enrichment of JmCs in 15 homologous gene clusters. The genes are clustered based on the JmCs’ enrichments by k-means. (E) Motifs enriched in joint metaclusters. The top heatmap shows the enrichment of motifs in the cCREs in each JmC in human (H) and mouse (M) as a Z-score. The logo for each motif is given to the right of the heat map, labeled by the family of transcription factors that recognize that motif. The heatmap below is aligned with the motif enrichment heatmap, showing the mean esRP score for the cCREs in each JmC for all the common cell types examined between human and mouse. A summary description of the cell types in which the cCREs in each JmC are more active is given at the bottom.

