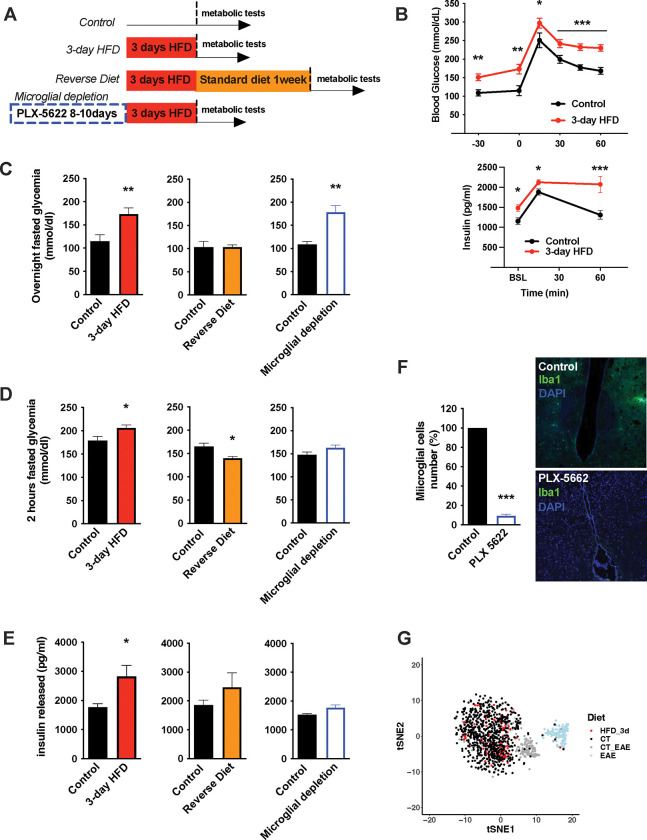
FIGURE 1: Acute HFD-induced metabolic changes are microglia dependent.
A. Schematic depicting the different treatments and diets followed by the different mice groups.
B. Graphs showing the Glucose Tolerance Test (OGTT) and the associated-insulin kinetic of C57Bl6/J male fed with control diet (Control) or fed with high fat diet for 3 days (3-day HFD) (n=8).
C. Graph showing the overnight fasted glycemia from the mice groups depicting in the A. Schematic (n=5 to 11).
D. Graph showing the 2hours-fasted glycemia from the mice groups depicting in the A. schematic (n=5 to 11).
E. Graph showing the insulin released after a glucose gavage from the mice groups depicting in the A. schematic (n=5 to 11).
F. Microglial cells staining with Iba1 (green) in the brain slices from mice fed with 3 days HFD or mice depleted from their microglial cells with 1 week control diet complexed with PLX-5662 prior the 3 days HFD (PLX-5662) (n=5).
G. sgRNAseq dataset from hypothalamic microglia cells harvested from C57bl6/J male mice fed with control diet (CT) and High Fat Diet for 3 days (HFD_3d) (n=5) merged with sgRNAseq microglia dataset from mice presenting an Experimental Autoimmune Encephalomyelitis (EAE).
Data are presented as mean ±SEM. *p<0.05, **p<0.01, ***p<0.001 as determined by two-tailed Student’s test and two-way ANOVA followed by Bonferroni post hoc test.

