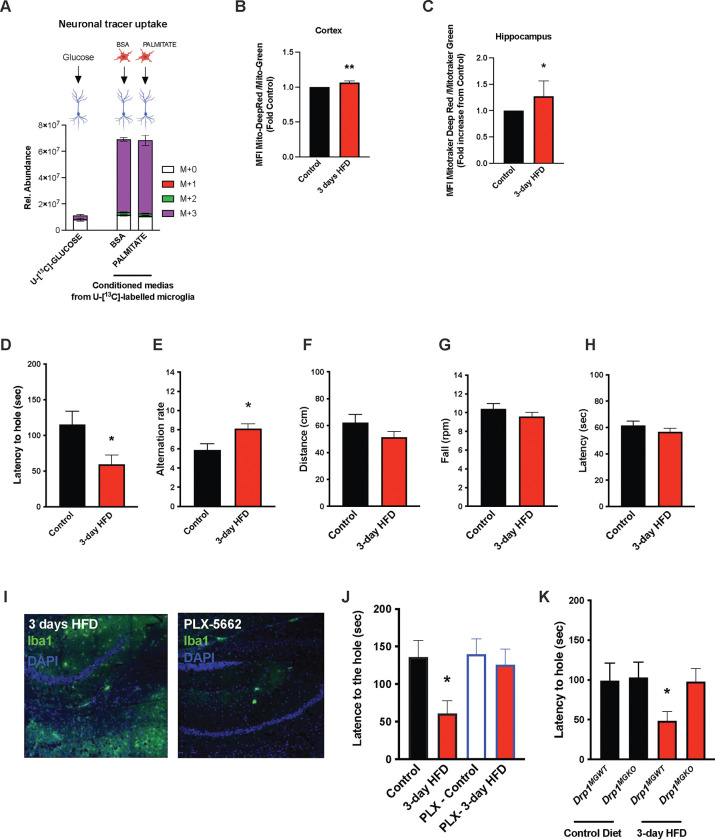
FIGURE 5: Acute HFD induces widespread MMR and rapid modulation of spatial and learning memory.
A. Primary microglial cell media was collected after the 13C-glucose tracing (containing 13C-lactate released by microglia challenged with BSA or Palmitate) and incubated for 4 hours with primary neurons, the graph shows the 13C-lactate incorporation in the neurons in relative abondance, as control, primary neurons were incubated directly with 13C-glucose (n=6).
B. Graph showing the ratio Mitotraker Deep Red/ Mitotraker Green from sorted cortical microglial cells of C57Bl6/J male fed with a control diet (Control) or fed with high fat diet for 3 days (3-day HFD) (n=5 to 12).
C. Graph showing the ratio Mitotraker Deep Red/ Mitotraker Green from sorted hippocampic microglial cells of C57Bl6/J male fed with a control diet (Control) or fed with high fat diet for 3 days (3-day HFD) (n=5 to 12).
D. Graph showing the latency during the Barnes Test from mice fed with normal diet (Control) or 3 days HFD (3-day HFD) (n=11). The test was performed in the VAI animals facility (USA).
E. Graph showing the alternation during the T Maze Test from mice fed with normal diet (Control) or 3 days HFD (3-day HFD) (n=11). The test was performed in the VAI animals facility (USA).
F. Graph showing the distance walked during the ROTAROD test from mice fed with normal diet (Control or 3 days HFD (3-day HFD) (n=11).
G. Graph showing the number of turn before the mice fall during the ROTAROD test from mice fed with normal diet (Control) or 3 days HFD (3-day HFD) (n=11).
H. Graph showing the latency during the ROTAROD test from mice fed with normal diet (Control) or 3 days HFD (3-day HFD) (n=11).
I. Microglial staining with Iba1 (green) in the Hippocampus slices from mice fed with 3 days HFD or mice depleted from their microglial cells with 1 week control diet complexed with PLX-5662 prior the 3 days HFD (PLX-5662) (n=5).
J. Graph showing the latency during the Barnes Test from mice fed with normal diet (Control) (n=4), mice fed with 3 days HFD (3-day HFD) (n=6), mice depleted from their microglial cells with 1 week control diet complexed with PLX-5662 (PLX-Control) (n=8) or mice depleted from their microglial cells with 1 week control diet complexed with PLX-5662 prior the 3 days HFD (PLX-3-day HFD) (n=5).
K. Graph showing the latency during the Barnes Test from Drp1MGWT or Drp1MGKO mice fed with normal diet (Control diet ) or with 3 days HFD (3-day HFD) (n=11).
Data are presented as mean ±SEM. *p<0.05, **p<0.01, ***p<0.001 as determined by two-tailed Student’s test and two-way ANOVA followed by Bonferroni post hoc test.

