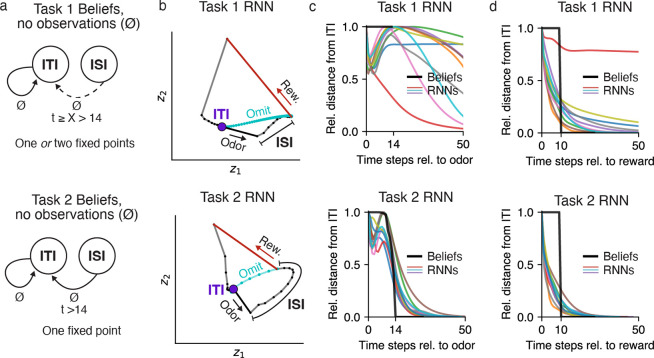
Fig 5. Value RNN dynamics resembled belief dynamics in each task.
a. Dynamics of beliefs in Task 1 (top) and Task 2 (bottom). Black arrows indicate transitions between states in the absence of observations (∅) as a function of elapsed time, t, following an odor observation. ‘X’ indicates an unconstrained duration, and a dashed arrow indicates a transition that happens only when ‘X’ is finite. b. RNN activity at each time step (small black dots with connected lines) during an example trial in a 2D subspace identified using PCA. Putative ITI fixed point indicated as purple circle. Vectors indicate the response to odor (black) and reward (red). Activity during an omission trial is shown in cyan, though note that omission trials were present in training data only for Task 2. c-d. Average normalized distance of each model’s activity from its fixed point (identified numerically) following an odor (panel c) or reward (panel d) observation, over time. To allow comparing distances across models, each model’s distances were normalized by the maximum distance following each observation.

