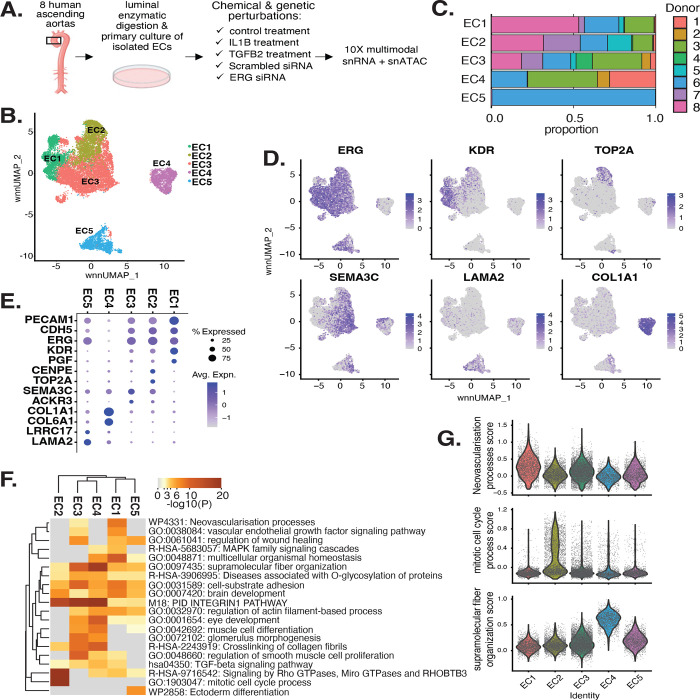
Figure 1 |. EC transcriptomic profiles reveal a heterogenous population.
(A), Schematic diagram of the experimental design. ECs are isolated from eight donor human ascending aortic trimmings and treated with IL1B, TGFB2, or siERG (ERG siRNA) to induce EndMT. (B), Weighted Nearest Neighbor UMAP (wnnUMAP) of aggregate cells from all perturbations and donors. Briefly, the WNN procedure implemented in Seurat v4 is designed to integrate multiple types of data that are collected in the same cells to define a single unified representation of single-cell multimodal data. Each dot represents a cell, and the proximity between each cell represents the similarity between both transcriptional and epigenetic profiles. Colors denote different clusters. (C), Stacked bargraph indicating proportion of cells from each donor for each EC subtype. (D), Feature plot displaying gene expression across cells of top markers for pan EC (ERG), EC1 (KDR), EC2 (TOP2A), EC3 (SEMA3C), EC4 (LAMA2), and EC4 (COL1A1). (E), Dot plot of top markers for pan EC (PECAM1, CDH5, ERG), EC1 (KDR, PGF), EC2 (CENPE, TOP2A), EC3 (SEMA3C, ACKR3), EC4 (COL1A1, COL6A1), and EC5 (LRRC17, LAMA2). The size of the dot represents the percentage of cells within each EC subtype that express the given gene, while the shade of the dot represents the level of average expression (“Avg. Expn.” in the legend). (F), Heatmap of pathway enrichment analysis (PEA) results from submitting top 200 differentially expressed genes (DEGs; by ascending p-value) between EC subtypes. Rows (pathways) and columns (EC subtypes) are clustered based on −Log10(P) (G), Violin plots of top Metascape pathway module scores across EC subtypes. Module scores are generated for each cell barcode with Seurat function AddModuleScore.

