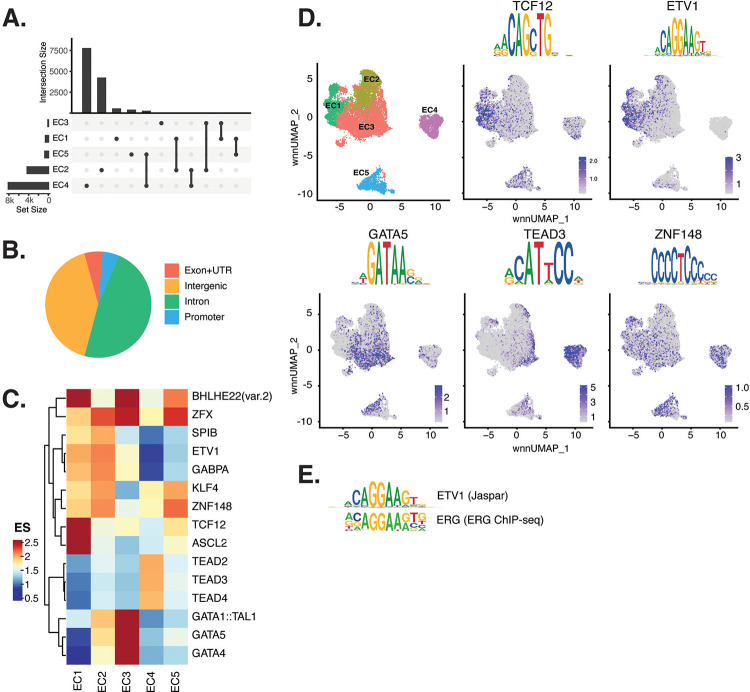
Figure 2 |. ECs have epigenetically distinct cell states.
(A), Upset plot of differential peaks across EC subtypes. Intersection size represents the number of genes at each intersection, while set size represents the number of genes for each EC subtype. (B), Genomic annotation for the complete peak set. (C), Heatmap of top transcription factors (TFs) from motif enrichment analysis for marker peaks in each EC subtype. Top TFs for each EC subtype are selected based on ascending p-value. Rows (TFs) and columns (EC subtype) are clustered based on enrichment score (ES). (D), Feature plots and position weight matrices (PWMs) for top TF binding motifs for EC1 (TCF12), EC2 (ETV1), EC3 (GATA5), and EC4 (TEAD3). Per-cell motif activity scores are computed with chromVAR, and motif activities per cell are visualized using the Signac function FeaturePlot. (E), PWMs comparing Jaspar 2020 ETV1 motif to ERG motif reported in Hogan et al.

