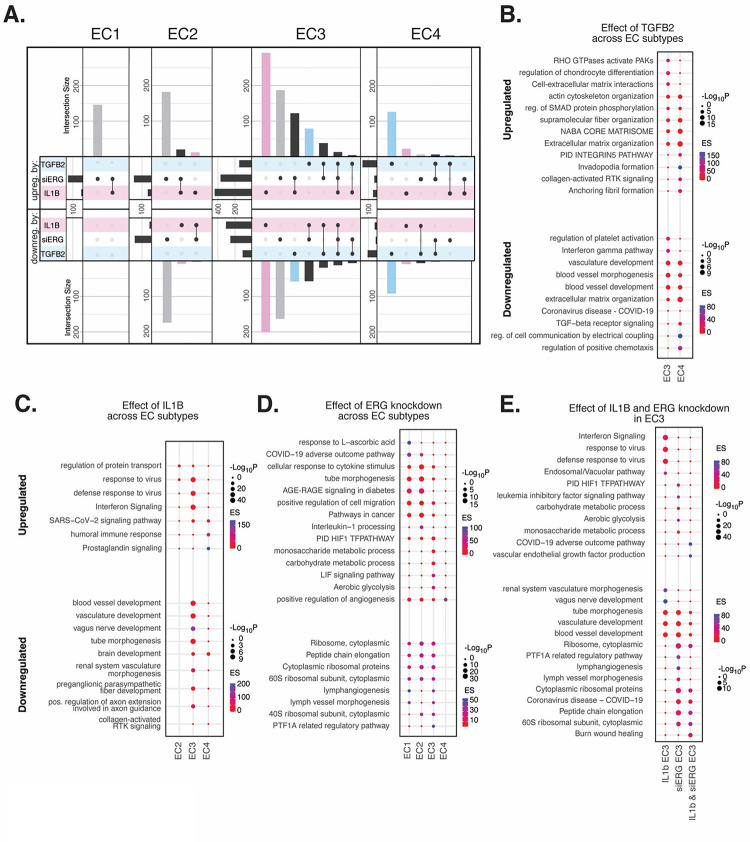
Figure 4 |. EC activating perturbations in vitro elicit EC subtype-specific transcriptional responses.
(A), Upset plots of up- and down-regulated DEGs across EC subtypes with siERG (grey), IL1B (pink), and TGFB2 (blue). Upset plots visualize intersections between sets in a matrix, where the columns of the matrix correspond to the sets, and the rows correspond to the intersections. Intersection size represents the number of genes at each intersection. (B), PEA for EC3–4 up- and down-regulated DEGs with TGFB2 compared to control media. (C), PEA for EC2–4 up- and down-regulated DEGs with IL1B compared to control media. (D), PEA for EC1–4 up- and down-regulated DEGs with siERG compared to siSCR. (E), PEA comparing up- and down-regulated DEGs that are mutually exclusive and shared between IL1B and siERG in EC3.

