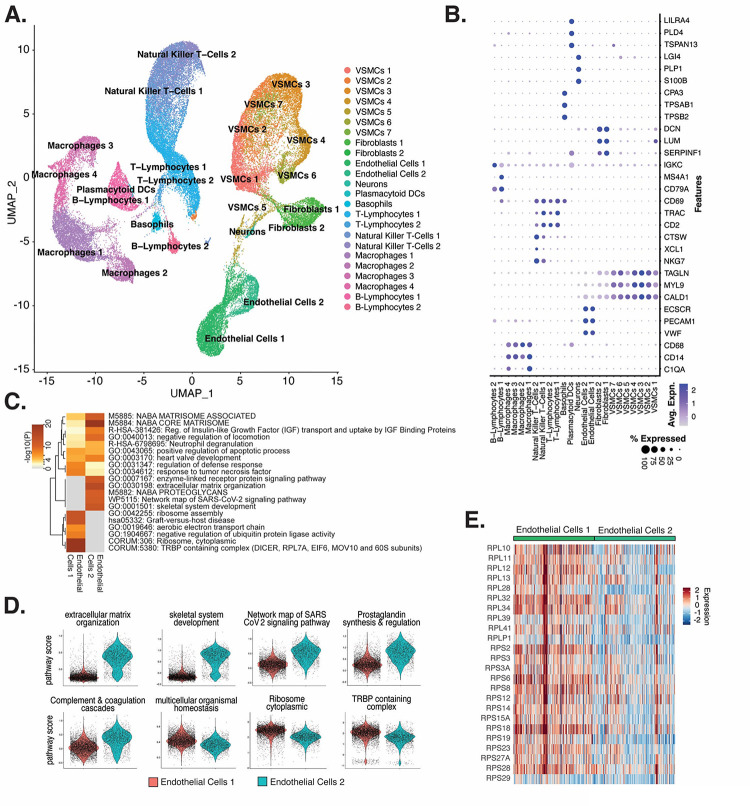
Figure 5 |. ECs from ex vivo human atherosclerotic plaques show two major populations.
(A), scRNA-seq UMAP of different cell subtypes across 17 samples of ex vivo human atherosclerotic plques. (B), Dot plot of top markers for each cell type. (C), Heatmap of pathway enrichment analysis (PEA) results generated from submitting 200 differentially expressed genes (DEGs) between Endothelial Cells 1 (Endo1) and Endothelial Cells 2 (Endo2). Rows (pathways) and columns (cell subtypes) are clustered based on −Log10(P). (E), Heatmap displaying expression of genes belonging to ribosome cytoplasmic pathway for Endo1 and Endo2.

