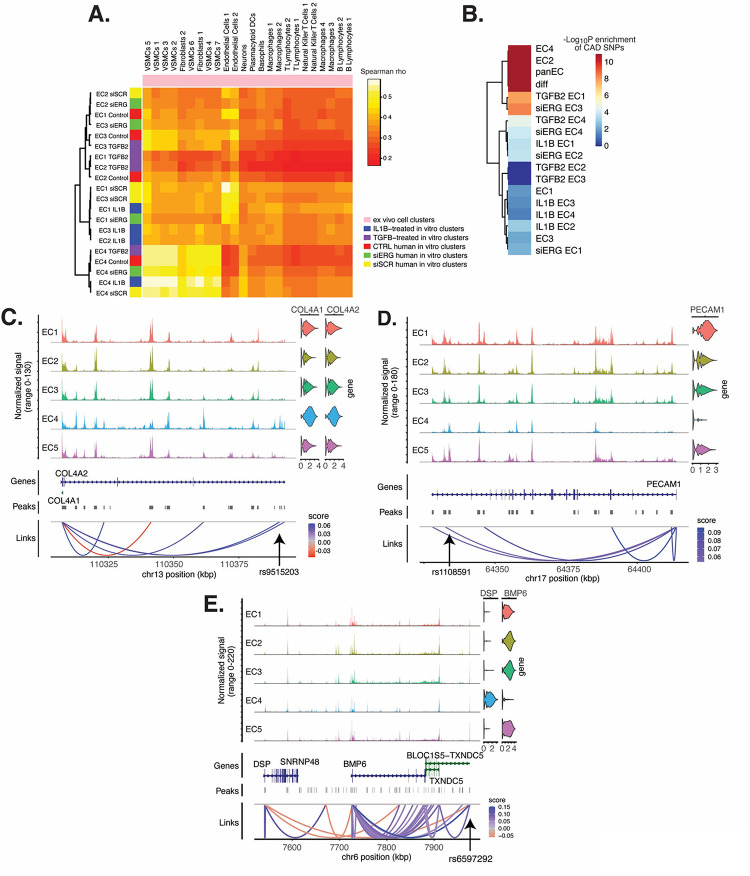
Figure 6 |. EC subtype is a major determinant in the ability to recapitulate ‘omic profiles seen in atherosclerosis.
(A), Heatmap displaying average expression between in vitro perturbation-subtype combinations and ex vivo cell subtypes using all up- and down-regulated genes between IL1B, TGFB2, or siERG versus respective controls. Spearman correlation was used as the distance metric. Rows (in vitro EC subtypes) and columns (ex vivo cell subtypes) are clustered using all significant genes (adjusted p-value < 0.05) induced and attenuated across all in vitro EC subtypes for each perturbation versus its respective control. (B), Heatmap of CAD-associated SNP enrichments across in vitro EC subtypes and perturbation-subtype combinations. Rows (EC subtypes and perturbation-subtype combinations) are clustered using −Log10(P) for enrichment in significant CAD-associated SNPs (p-value < 5×10⁻⁸). Note that “diff” represents peaks common to more than one EC subtype; it is found by subtracting EC1–5 subtype-specific peaks from the entire in vitro peak set (termed “panEC”). (C), Coverage plots displaying links for COL4A1/COL4A2 genes to EC4-specific peaks, including one overlapping with CAD-associated SNP rs9515203. (D), Coverage plot showing links for PECAM1 gene to EC4-specific peaks, including one overlapping with CAD-associated SNP rs1108591. (E), Coverage plot showing links for BMP6 gene to EC4-specific peaks, including one overlapping with CAD-associated SNP rs6597292.

