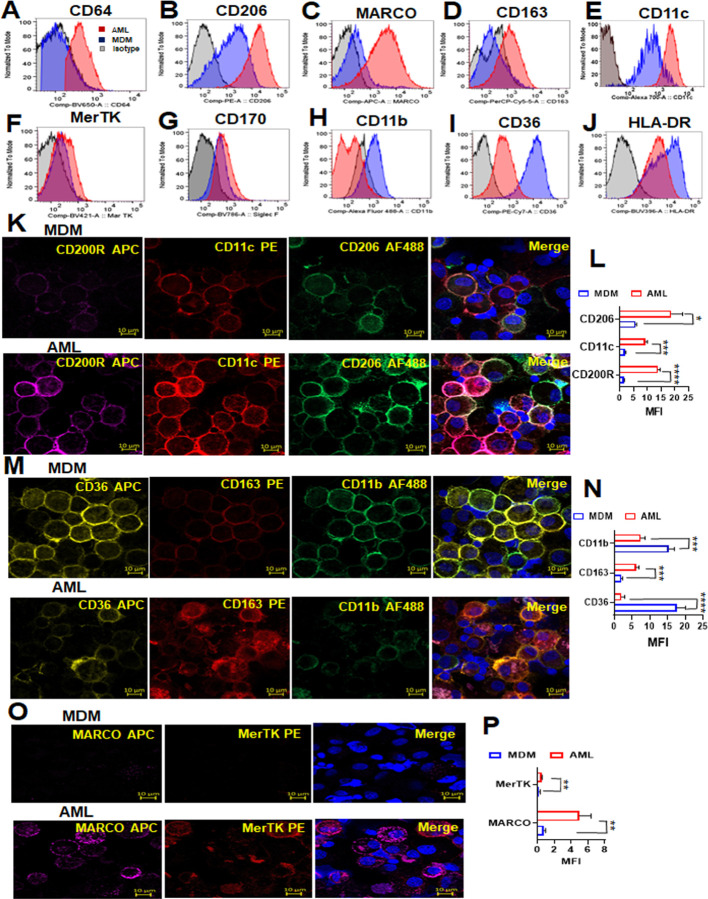
Fig 6. Phenotypic and functional characterization of AML cells compared to MDM.
(A-J) PBMCs were exposed to ALL cocktail for 6 days on alternative days or left untreated (MDM). Flow cytometry data reveal that the AML cell surface phenotype resembles HAM with increased expression of (A) CD64, (B) CD206, (C) MARCO, (D) CD163, (E) CD11c, (F) MerTk and (G) CD170, and decreased expression of (H) CD11b, (I) CD36 and (J) HLA-DR when compared to MDM. Control fluorescence is shown in grey, and specific fluorescence for AML cells in red and MDM in blue. (K, M, O) The cells were immunostained with the indicated antibodies and DAPI for nucleus (blue), then imaged with confocal microscopy. Scale bar: 10µm and 63x magnification. (L, N, P) Confocal data were quantified by MFI and represented as bar graphs. Representative experiment of n = 3, mean ± SD and analyzed by Unpaired Student’s ‘t’ test *p≤0.05, ** p≤0.01, ***p≤0.001, ****p≤0.0001.

