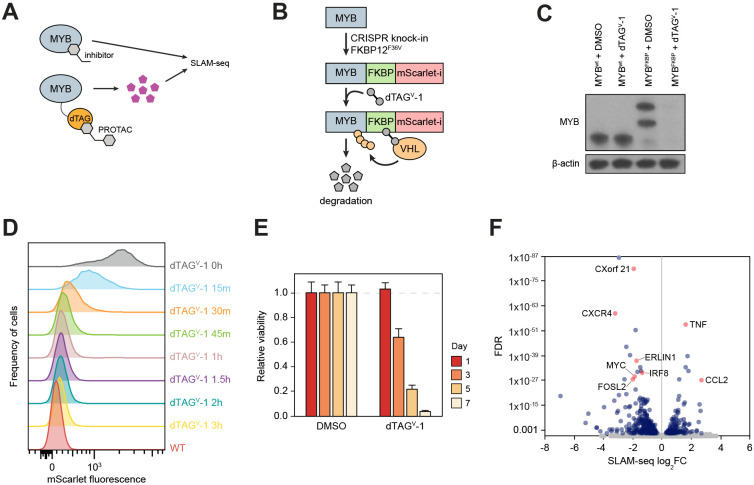
Figure 1. A chemical degron model of MYB.
(A) Study overview.
(B and C) Schematic (B) and Western blot (C) demonstrating endogenous MYB degron tagging by CRISPR-HDR and subsequent targeted degradation of the fusion protein.
(D) A time course experiment where MYB degradation is followed by FACS measurement of the fusion protein fluorescence.
(E) Relative cell viability measured at various points after MYB degradation.
(F) Volcano plot of genome-wide changes in transcription rates measured by SLAM-seq 1 hour after MYB degradation.

