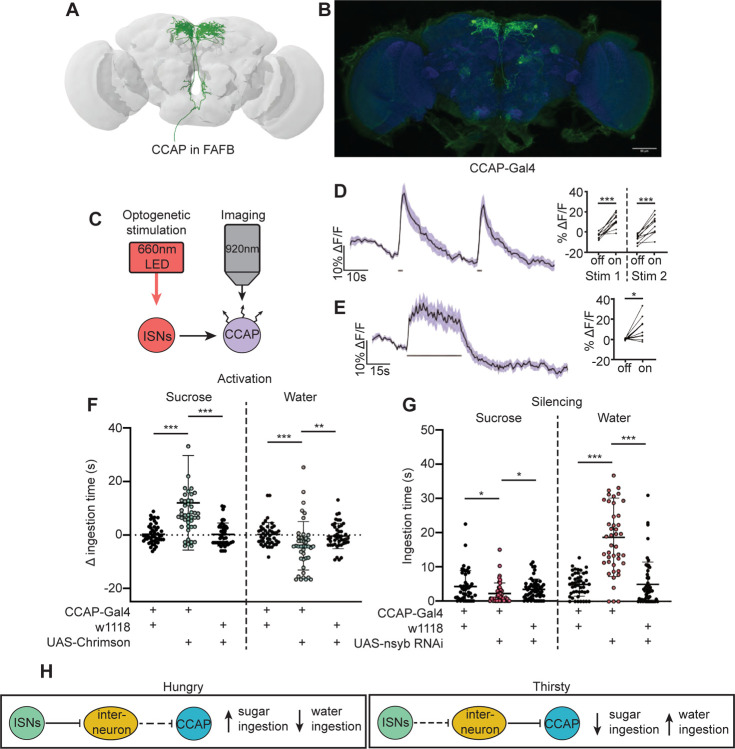
Figure 5. CCAP neurons are downstream of the ISNs and oppositely regulate sugar and water ingestion.
(A) CCAP neurons reconstruction from FAFB dataset. (B) Light microscopy image of CCAP-Gal4. (C) Experimental setup for in vivo calcium imaging. We expressed the light sensitive ion channel Chrimson in the ISNs and optogenetically stimulated them with 660nm LED. We expressed the calcium sensor GCaMP in the CCAP neurons and imaged them with a 2 photon microscope. (D) Calcium response of CCAP neurites to 2s optogenetic stimulation of the ISNs or (E) 30s optogenetic stimulation of the ISNs. Left: Scatter plot shows mean +/− SEM of all flies imaged, gray bars represent LED stimulation. Right: Quantification of mean fluorescence intensity before stim (off) and during stim (on), each dot represents one fly. Paired t-test. n=10 flies. (F) Temporal consumption assay for 1M sucrose or water during acute optogenetic activation of CCAP neurons with Chrimson. Ingestion time of females exposed to light normalized to dark controls of indicated genotype. Sucrose: Kruskal-Wallis with Dunn’s multiple comparison test, Water: One-way ANOVA with Holm-Šídák multiple comparison test. n=42–48 animals/genotype. (G) Temporal consumption assay for 1M sucrose or water using RNAi targeting nSyb in CCAP neurons. Kruskal-Wallis with Dunn’s multiple comparison test. n=45–54 animals/genotype. (H) Neural model for CCAP coordination of sugar and water intake. Dashed lines indicate inactive synapses. *p<0.05, **p<0.01, ***p<0.001

