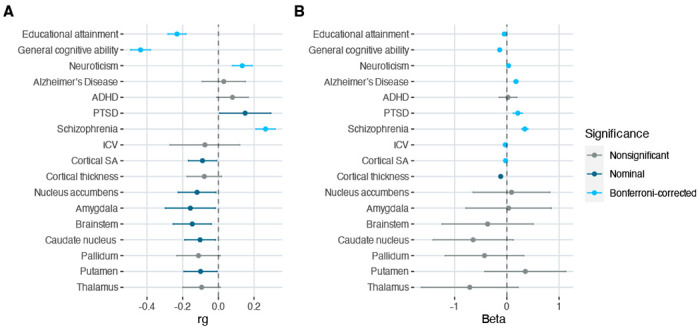
Figure 3. Genetic correlations and phenotypic associations between RTV and 17 selected traits.

Genetic correlations were calculated with LD score regression using SNP summary statistics from discovery RTV-GWAS and publicly available summary statistics for other traits (Supplementary Table 1). Associations between RTV and the same 17 traits were calculated using phenotypic data from the UK Biobank (Supplementary Methods). Point estimates for correlations and beta coefficients are shown with 95% confidence intervals. Dark blue dots indicate nominally significant p-values and light blue dots indicate significant p-values after Bonferroni correction.
