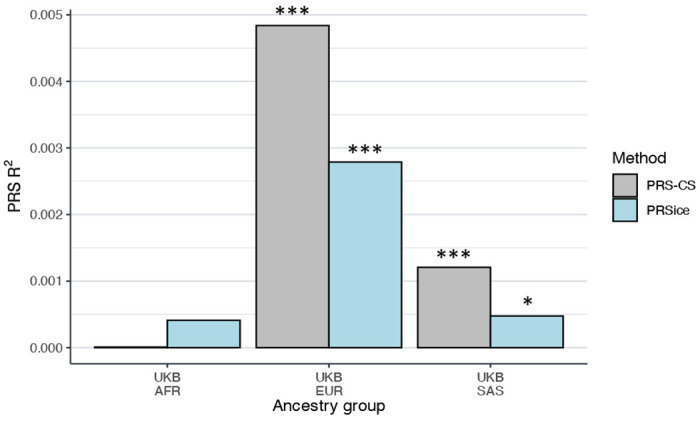
Figure 4. Bar chart showing the predictive accuracy of the RTV-PGS in three independent cohorts.

Prediction of RTV by polygenic score (PGS) in the African, non-British European, and South Asian ancestry groups from the UK Biobank. The predictive accuracy of the PGS (R2) was assessed in each cohort for a PGS calculated using two methodologies, PRSice and PRS-CS. PRSice PGS were calculated using all single nucleotide polymorphisms surviving LD pruning from the discovery GWAS (p-value threshold of 1).
*p<0.05, ***p<2.63 x 10⁻³
