Figure 2.
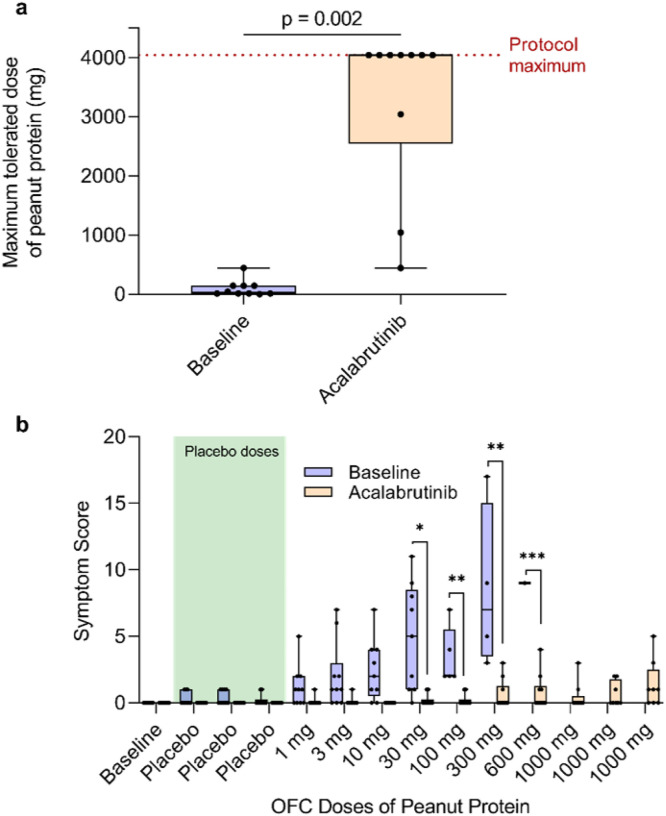
Maximum tolerated peanut dose and symptom scores during OFC.
a, The maximum tolerated dose of peanut protein at baseline (dark gray box with blue circles) and during treatment with acalabrutinib (light gray box with orange circles) is shown for all patients (n = 10). The maximum protocol dose was 4,044 mg, thus patients’ tolerated doses of ≥4,044mg on acalabrutinib is plotted at this maximum. Boxplot midline represents median, box depicts 25th and 75th percentiles, and whiskers depict range. Data were tested using a Wilcoxon matched-pairs signed rank test. b, Total symptom scores are shown during each placebo (benign food) and peanut dose during baseline OFC (blue circles and dark gray boxes) and during OFC while on acalabrutinib (orange circles and light gray boxes). The shaded green area represents placebo doses of each OFC. Box plot midline represents the median, box depicts 25th and 75th percentiles, and whiskers depict range. * p < 0.05; ** p < 0.01; *** p < 0.001. OFC, oral food challenge.

