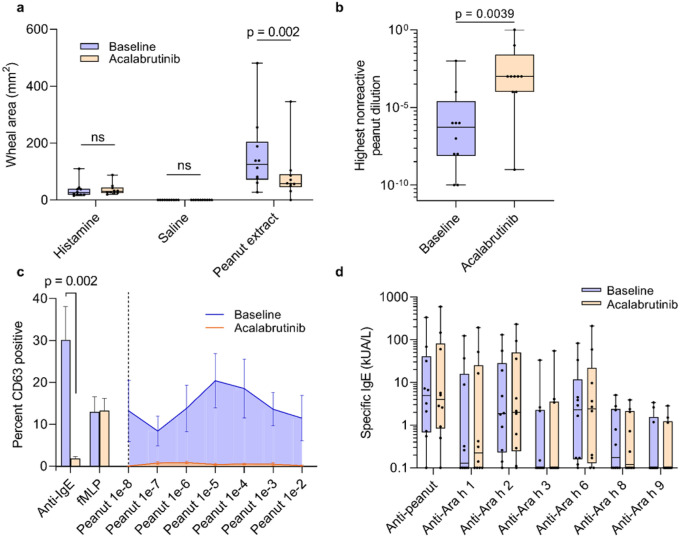
Figure 3.
Secondary outcomes
a, Skin puncture test wheal area (in mm2) to undiluted peanut extract and positive (histamine) and negative (saline) controls at patients’ baseline and during treatment with acalabrutinib are shown for all patients. b, The highest concentration of peanut extract (original units, weight per volume) that produced a negative skin test at baseline and during acalabrutinib treatment is shown for all patients. Boxplot midline represents median, box depicts 25th and 75th percentiles, and whiskers depict range. Data were analyzed using Wilcoxon matched-pairs signed rank tests. c, On the left side of the graph, the percent of basophils activated ex vivo in response to anti-IgE and dilutions are shown for all patients at baseline (blue bars) and after treatment with acalabrutinib (orange bars). On the right, basophil response percentages are displayed for each peanut extract dilution at baseline (blue area under the curve) and after acalabrutinib treatment (orange area under the curve). Data were analyzed using Wilcoxon matched pairs signed rank tests. bars represent standard error. d, Peanut and peanut-component specific IgE levels for all patients at baseline (blue circles) and during acalabrutinib treatment (orange circles) are shown. Box plot midline represents the median, box depicts 25th and 75th percentiles, and whiskers depict range. fMLP, N-formylmethionyl-leucyl-phenylalanine.

