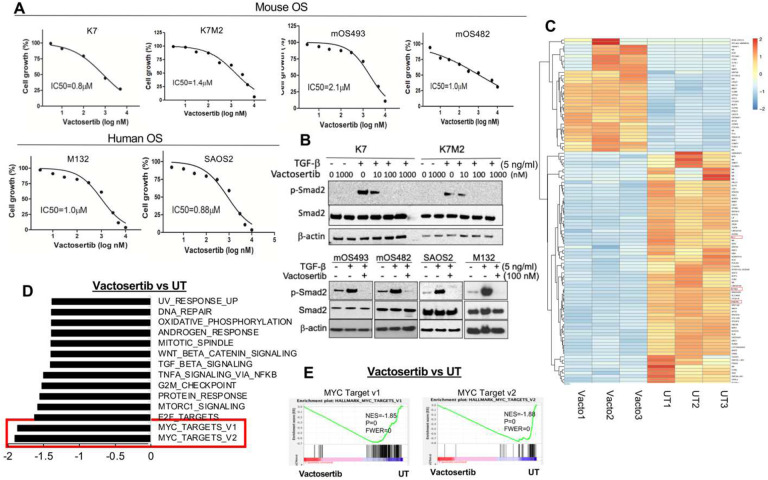
Figure 1. Vactosertib inhibits OS cell growth and TGF-β1 pathways.
A) Effects of Vactosertib on OS proliferation. Various doses of Vactosertib (10 nM–10 μM) were incubated with mOS (K, K7M2, mOS493, and mOS482) or hOS (M132 and SAOS2). Cell growth was quantified over a 4 day period using the IncuCyte Imaging System. Nonlinear regression (curve fit) equation was calculated using GraphPad prism (N=5/group). B) Vactosertib inhibits TGF-β1 signaling pathway in OS cells. Various doses of Vactosertib (10–1000 nM) were used to treat in K7, K7M2, mOS493, mOS482, SAOS2 and M132 cells 15 minutes before TGF-β1 (5ng/ml) treatment. 1 hour after TGF-β1 treatment, cells were harvested and p-Smad2, Smad2 and β-actin expressions were measured by Western blot analysis. C-E) RNA-sequencing analysis of human OS (SAOS2) cells after Vactosertib (100 nM) or untreated (UT) for 24 hours (n=3). C) Clustered Heatmap showing the differential regulated genes identified in Vactosertib treated (Vacto) and untreated (UT) samples. These genes had an adjusted P value of <0.05 and log2 FC > 0.3 or log2 FC < −0.3. D) Hallmark Pathways from Gene Set Enrichment Analysis (GSEA) revealed dysregulated pathways in Vactosertib treated cells. P values is =0.00 and FWER is <0.05. E) GSEA enrichment plot identified downregulation of MYC target v1 and v2 pathway in Vactosertib treatment versus untreated treatment (UT).

