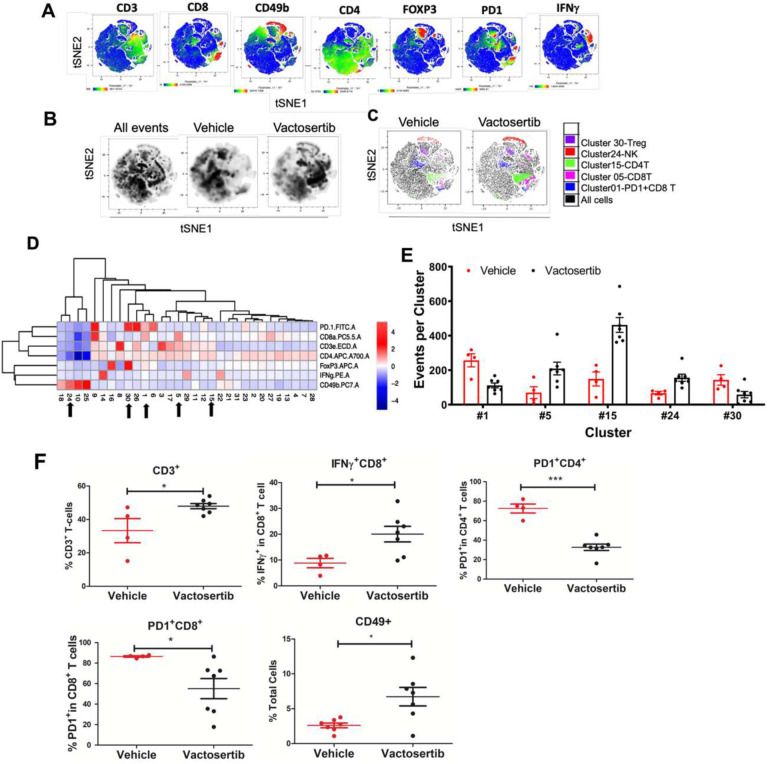
Figure 6. The effects of Vactosertib on tumor extrinsic T-cell profile.
BALB/c mice were inoculated with 1×10⁶ K7M2-Luc (i.v).on Day 0, and then treated with vehicle (p.o) or Vactosertib (50 mg/kg, p.o. 5 days/week) starting on day 28 (4 weeks). 10 weeks after tumor injection, lung samples were collected, flow cytometry was performed and expression of CD3, CD4, CD8, CD49b, Foxp3, PD-1 and IFNγ was determined by flow cytometry. Unbiased immune cell profiling on 5000 live cells by t-Distributed Stochastic Neighbor Embedding (t-SNE) analysis was performed. A) tSNE heatmap plots show the MFI expression level and the distribution of each indicated marker. Low to high levels of protein expression are depicted in the gradient from blue (low) to red (high). B) tSNE density plots of live cells in vehicle or Vactosertib treated samples. C) tSNE dotplot overlays of clusters with significant differences (p<0.01) between vehicle and Vactosertib treatment groups. D) Heatmap showing the normalized MFI of the markers by T-cell cluster (low to high; blue to red); arrows indicate significant difference of events between vehicle and Vactosertib groups (p<0.01). E) Bar graphs showing selected clusters with significant difference of events between vehicle and Vactosertib groups (p<0.01). F) The frequency of T cell markers by conventional FACS analysis. Vehicle n=4, Vactosertib n=7 *p<0.05, ** p<0.01, using an unpaired two-tailed t-test.

