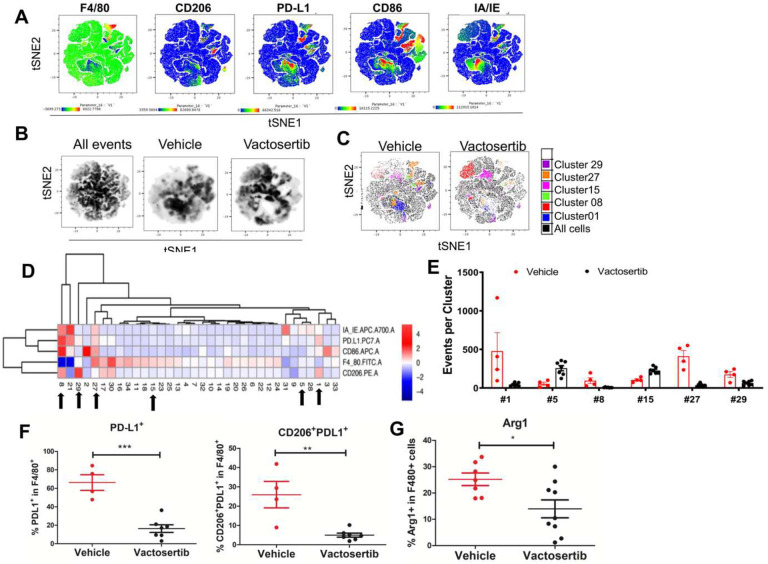
Figure 7. The effects of Vactosertib on tumor extrinsic myeloid cell profile.
BALB/c mice were inoculated with 1×10⁶ K7M2-Luc (i.v).on day 0, and then treated with vehicle (p.o) or 50 mg/kg Vactosertib (p.o. 5 days/week) starting on day 28 (4 weeks) 10 weeks after tumor injection, lung samples were collected and examined for expression of CD45.2, CD86, CD206, F4/80, IA/IE, and PD-L1 by flow cytometry. Unbiased immune cell profiling on 5000 live CD45.2+ cells by tDistributed Stochastic Neighbor Embedding (t-SNE) analysis was performed. A) tSNE heatmap plots show the MFI expression level and the distribution of each indicated marker; low (blue) to high (red). B) tSNE density plots of CD45.2+ cells in vehicle or Vactosertib treated samples. C) tSNE dotplot overlays of clusters with significant differences (p<0.01) between vehicle and Vactosertib treatment groups. D) Heatmap showing the normalized MFI of the markers by cluster (low to high; blue to red); arrows indicate significant difference of events between vehicle and Vactosertib groups. E) Bar graphs showing selected clusters with significant difference of events between vehicle and Vactosertib groups (p<0.01). F) The frequency of myeloid cell markers by conventional FACS analysis. Vehicle n=4, Vactosertib n=7, ** p<0.01, *** p<0.001 using an unpaired two-tailed t-test. G) % of Arg1+F480 + cells in lung of K7M2-luc bearing mice after vehicle and Vactosertib treatment. BALB/c mice were inoculated with 1×10⁶ K7M2-Luc (i.v).on day 0, and then treated with vehicle (p.o) or 50 mg/kg Vactosertib (p.o. 5 days/week) starting on day 28 (4 weeks) 10 weeks after tumor injection, lung samples were collected and examined for expression of Arg1+F4/80+ by flow cytometry. vehicle n=7, Vactosertib n=9. *p<0.05 using an unpaired two-tailed t-test.

