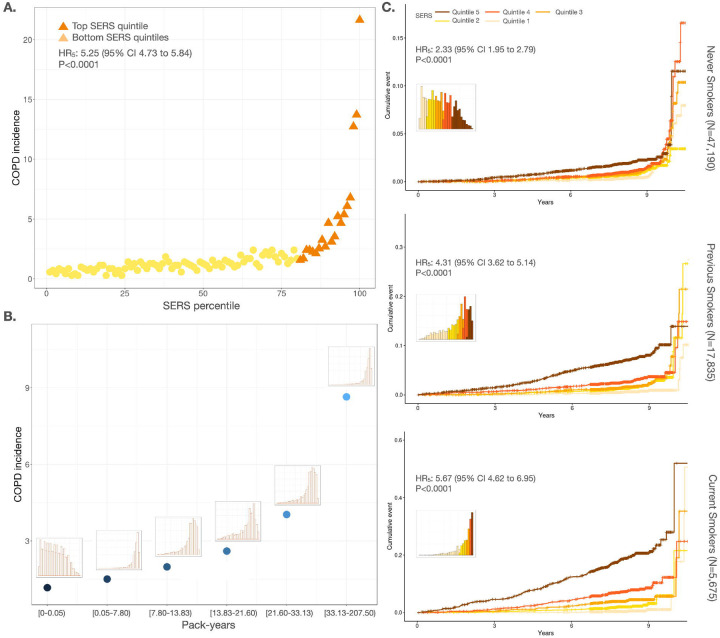
Figure 2:
Disease stratification and prediction by SERS across smoking statuses. a) Incidence of COPD in each percentile of the evaluation set. The top quintile is colored in dark orange. b) COPD incidence for each pack-year quintile. The distribution of SERS for individuals in each quintile is shown above each point. c) Cumulative incidence plots for never smokers (top), previous smokers (middle), and current smokers (bottom) stratified by SERS (orange shades) quintiles. The distribution of SERS for each smoking status is shown in each panel.

