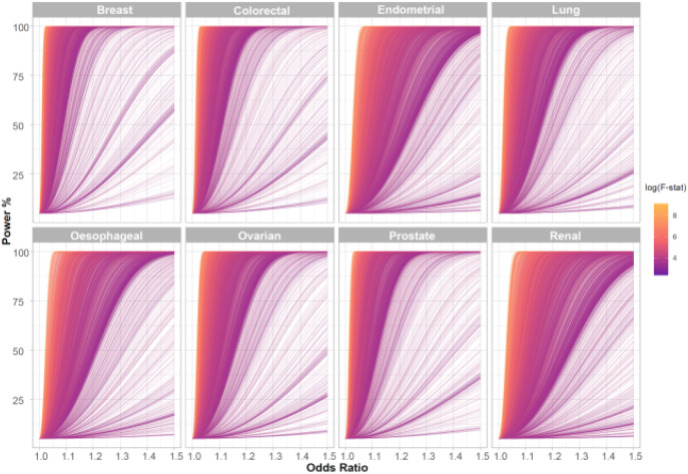
Figure 2. Power to demonstrate causal relationship in the Mendelian randomisation analysis across the eight different cancers.
Each line represents one trait with line colour indicating F-statistic, a measure of instrument strength. The analysis of most traits is well powered across a modest range of odds ratios and this generally corresponds to those with a higher F-statistic. F-stat, F-statistic

