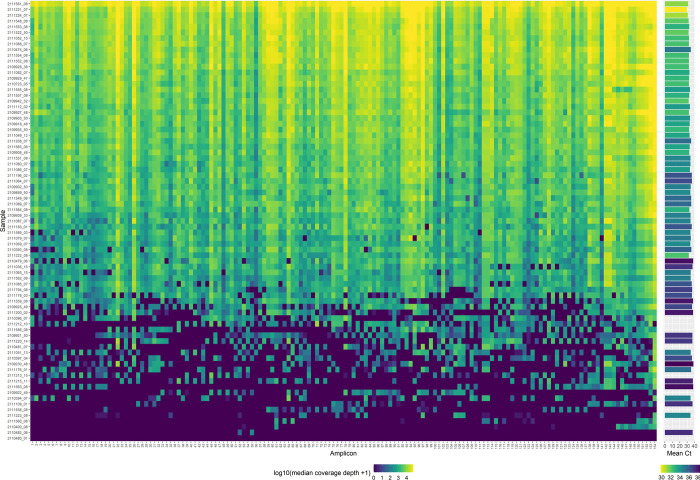
Fig 8. Coverage depth across the SARS-CoV-2 genome.
Heatmap visualising median coverage depth across each amplicon (left) for 77 sequenced wastewater samples, with the associated SARS-CoV-2 Ct value for each sample (right). Ct value of 0 refers to samples for which RT-qPCR failed to identify SARS-CoV-2.

