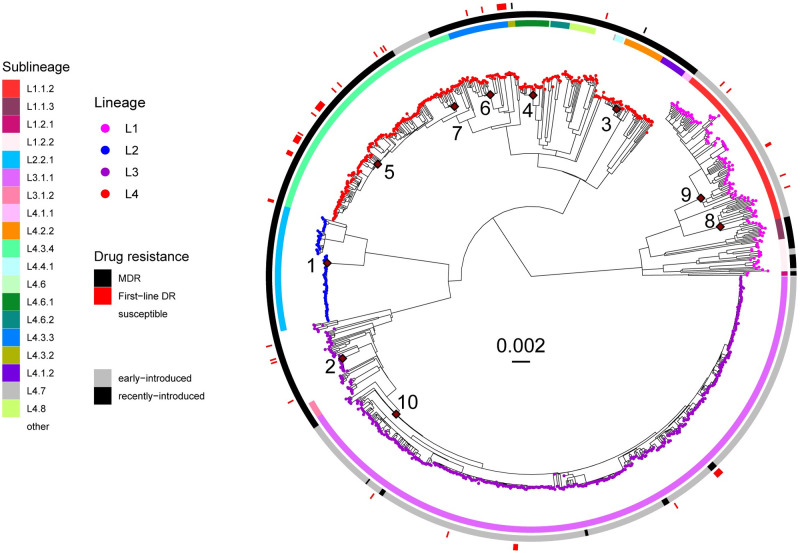
Fig 1. Phylogeny of 1082 Mtb genomes sampled from 2013–2019 in Dar es Salaam.
The tree is rooted with a M. canettii strain (SAMN00102920) and the scale bar indicates substitutions per site. Tips are colored according to the MTBC lineage and the innermost heatmap indicates MTBC sublineages according to [47]. The second heatmap indicates whether a strain is considered as recently-introduced or early-introduced based on a threshold of 0.2 for the relative age (See methods). The outermost heatmap indicates the genotypic drug resistance profiles for most commonly used drugs in Dar es Salaam (See methods). Only mutations giving rise to first-line drugs are considered. The MTBC introductions into Tanzania leading to most cases in our cohort are labelled from 1–10.

